Gold prices has seen sharp declines during early Asian trade, with price breaking the 1,385 level more comprehensively this time round unlike the yesterday’s attempt during early US session. The only reason why bears failed was due to the increased speculation surrounding Fed’s tapering decision or rather non-decision as evident via the rally in Treasuries during the same period. If we ignore that, price has been consistently bearish under 1,400, and the failure to reach Friday’s high last night is a huge strike against bullish momentum. Hence current break cannot be regarded as too surprising as a retest of the level was definitely in the books.
Hourly Chart
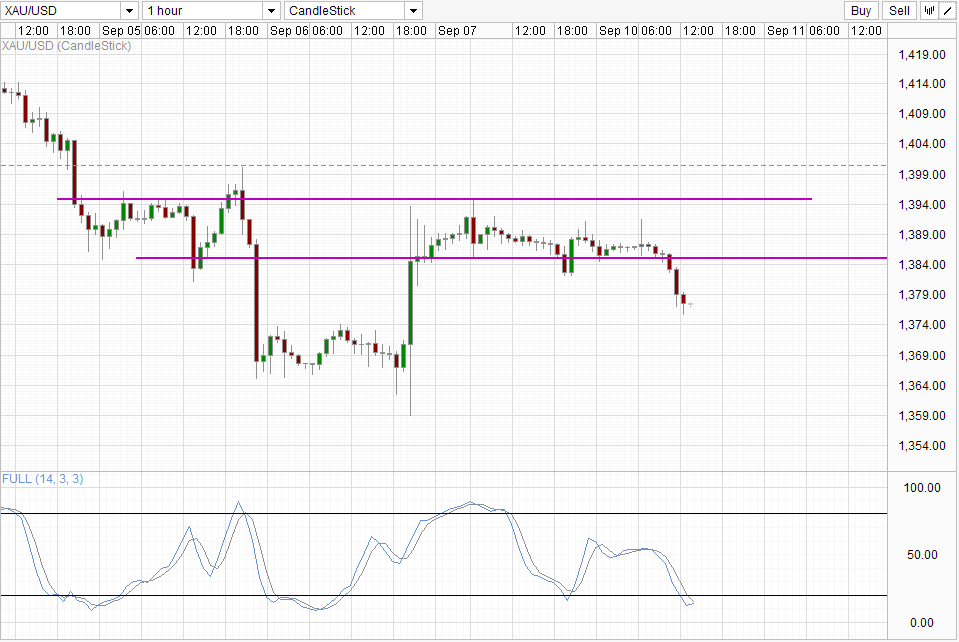
With this break, the consolidation zone between 1,365 – 1,375 opens up as the immediate bearish target. Ideally price should break 1,365 and form a new consolidation zone under the level in order to further current bearish momentum, but that may be hard considering that Stoch readings are already Oversold. We could see price finding support from the higher end of the consolidation zone without hitting the lower end support, but that may not necessary invalidate bearish momentum, and merely delay any further strong sell off in the near term.
Weekly Chart
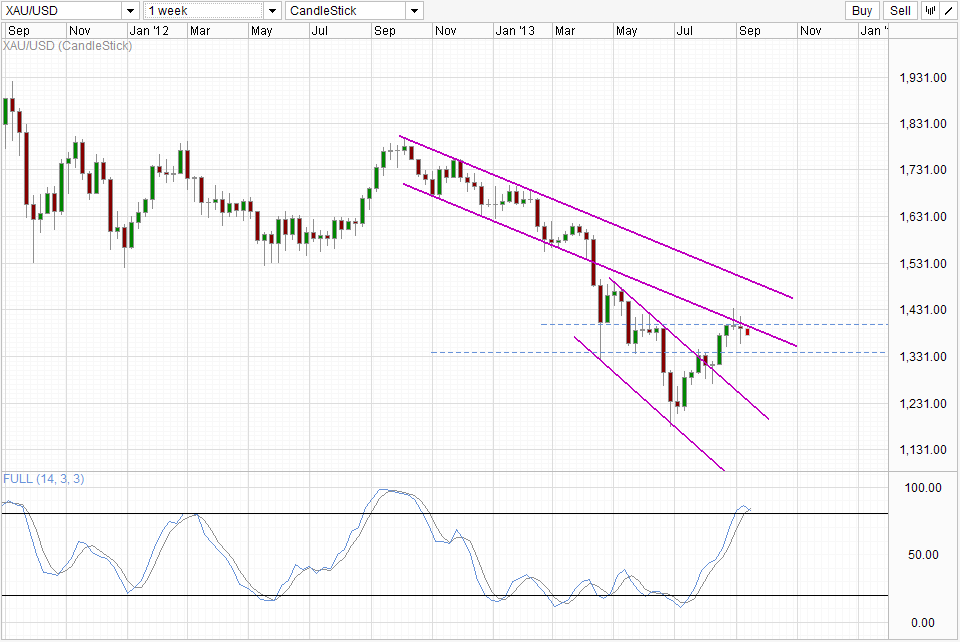
Weekly Chart agrees with the short-term prognosis. Breaking 1,365 will likely result in bearish acceleration since that is around the lows of last week and 3 weeks ago – the left candle of the Evening Star pattern discussed previously. However, even if we are unable to trade below 1,365, downward pressure asserted by the descending Channel Bottom and the 1,400 level will continue to nudge price towards the 1,330 -1,345 support band. Stochastic readings are also hinting of a bearish cycle that may be able to take us to the Channel Top below.
It has been repeated ad nauseam that there isn’t really any strong fundamental reason for Gold prices to rally. The only thing holding Gold up is the supposed Hedge Funds holdings that have been accumulated since low 1,200s. Should these Hedge Funds start to clear their positions, we could easily see price falling back to the 1,200 levels or perhaps even more. There are already some signs of cracks – latest Commitment of Traders data showed a slight decline in long positions despite prices pushing higher on a W/W basis. This may not necessary mean that Hedge Funds are starting to sell, but at the very least we can affirm that the venture above 1,400 last week isn’t supported by proper volume, a sign of potential reversal in the near future (if it’s not already here).
More Links:
GBP/USD – Places Pressure on Resistance Level at 1.57
AUD/USD – Tests Resistance Level around 0.9250 at Six Week High
EUR/USD – Surges to Two Week High above 1.3250
This article is for general information purposes only. It is not investment advice or a solution to buy or sell securities. Opinions are the authors; not necessarily that of OANDA Corporation or any of its affiliates, subsidiaries, officers or directors. Leveraged trading is high risk and not suitable for all. You could lose all of your deposited funds.

Mingze Wu
Latest posts by Mingze Wu (see all)
- European Bourses Not Enjoying Bullish Winds From US Stocks - 17 April 2014
- More Aggressive Stimulus Possible Despite Premier Li’s Denial - 17 April 2014
- China March FDI -1.5% Y/Y vs +2.05% expected. First decline in more than a year. - 16 April 2014