Crude Oil gained strongly yesterday, in line with various stronger economic numbers that was released yesterday. However, the bullish impact on Stocks wasn’t as great, suggesting that there was something else that fueled yesterday’s rally. If we factor in the fact that implied demand for Crude was actually lower based on latest Department of Energy Inventory numbers, the rally becomes even more inexplicable. Perhaps market was forgiving about the 2 million barrel miss for Crude Inventory, and instead focus on the higher implied demand in Distillates and Gasoline, which came in 450K barrels and 1.4 million barrels lower than expectation respectively. Unrest in Middle East continue to pressure Crude prices, but it is unlikely that we have a proper case for such attribution as there wasn’t any new development on the US political front.
Hourly Chart
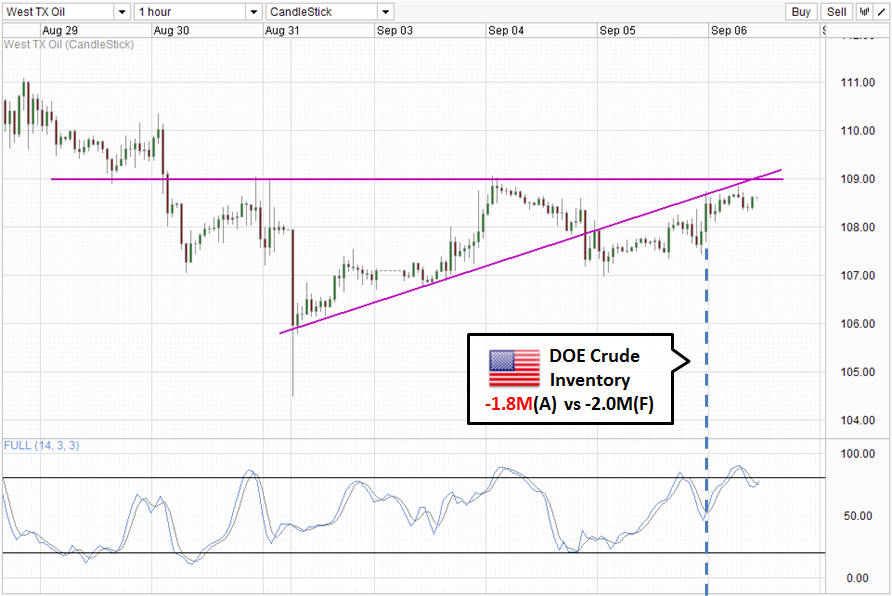
Hence, the above suggest that we do not truly have good reasons for WTI Crude prices to increase, at least not right now. This would limit prices ability to break the 109.0 resistance which is incidentally this week’s ceiling. Furthermore price is trading below the ascending trendline, with price touching it during early Asian session which was promptly sent lower once again, showing that the bearish influence of the trendline remains strong. Stochastic readings also suggest that we are currently in a bearish cycle. Stoch curve may be pointing higher right now, but that could simply be an interim trough and as such should not be regarded as a proper bullish signal unless we breach back within the Overbought region again which will likely coincide with a break of 109.0. If the Stoch bearish cycle signal is correct, we could see price moving towards 107.0 which is the 1st bearish target. A break of which may send prices closer to 105.0.
Daily Chart
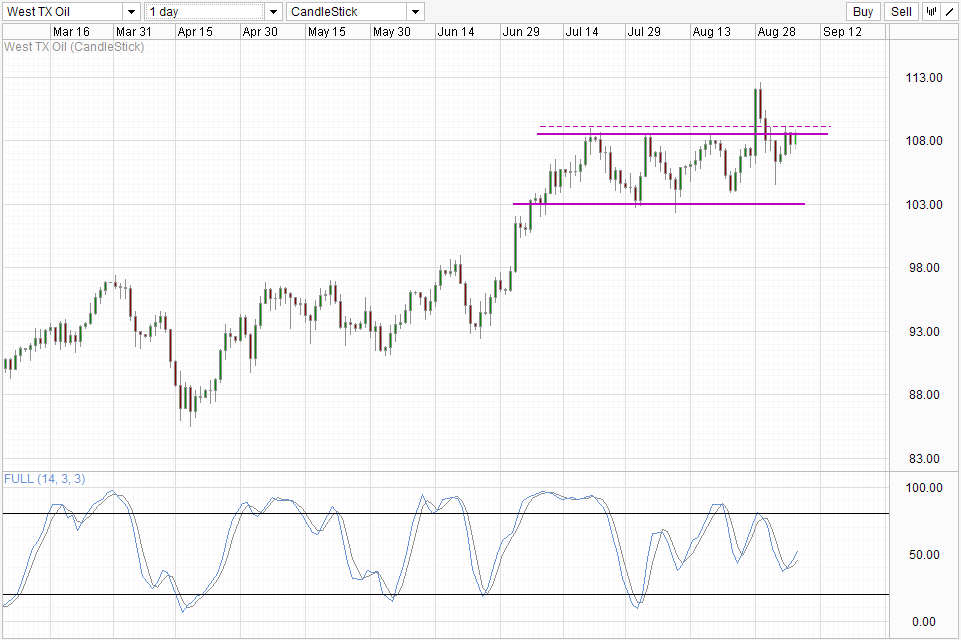
Once again nothing new on the daily chart. Prices is currently straddling the 108.5 resistance which extends to 109.1 based on the candlesticks wick. Stochastic readings here provides a stronger bullish signal compared to the Hourly Chart’s due to the divergence seen where this trough is lower than the previous 2, but current price dip is actually higher than the previous 2. Hence there is a potential sign that the sell off since 29th August may be too extreme, which bodes well for bullish correction. In order to affirm this bullish Stoch signal, readings should preferably push above the 50.0 mark which is the confluence with the previous trough level. However, if Stoch readings actually taper off around 50.0, we could see prices heading towards the 103.0 floor.
More Links:
AUD/USD – Eases Away from Two Week High at 0.92
EUR/USD – Falls Sharply to Seven Week Low near 1.31
USD/JPY – BOJ Kuroda Spurred Price to 100.0
This article is for general information purposes only. It is not investment advice or a solution to buy or sell securities. Opinions are the authors; not necessarily that of OANDA Corporation or any of its affiliates, subsidiaries, officers or directors. Leveraged trading is high risk and not suitable for all. You could lose all of your deposited funds.

Mingze Wu
Latest posts by Mingze Wu (see all)
- European Bourses Not Enjoying Bullish Winds From US Stocks - 17 April 2014
- More Aggressive Stimulus Possible Despite Premier Li’s Denial - 17 April 2014
- China March FDI -1.5% Y/Y vs +2.05% expected. First decline in more than a year. - 16 April 2014