US Stocks bettered (or worsen) Wed’s decline, with S&P 500 almost tripling Wed’s losses by closing 1.47% lower. Dow 30 only managed to double Wed’s loss, but still end up slightly more bearish than S&P 500 at -1.47% by the end of the day. The decline seemed to be a combination of factors. First off we have Industrial Production for the month of July which came in flat versus an expected increase of 0.3%. Previous month’s figures have also been revised lower to 0.2%. Philly Fed Index is also lower at 9.3, much lesser than the 15 expected and less than half of previous month’s stupendous 19.8 print. Market seems to react to the bearish news better, ignoring the better than expected Jobless Claims figures (320K vs 335K expected) that came in earlier. It seems that the stronger NAHB Housing Market Index also have limited bullish impact too, with prices gaping lower on open and stayed low throughout the rest of the trading session.
S&P 500 Daily Chart
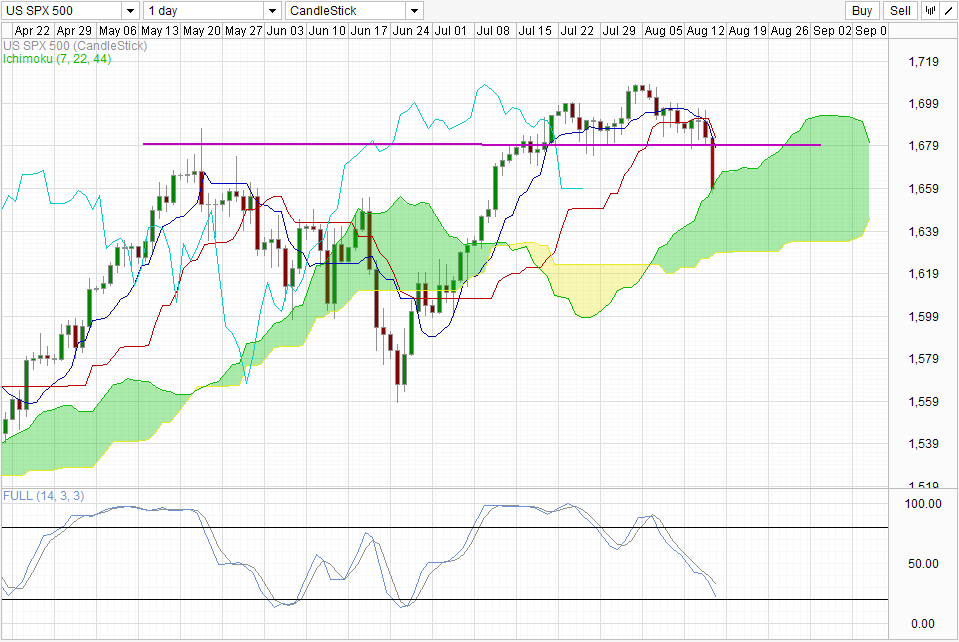
From the technical front, the break of 1,680 puts the uptrend from Jun lows at risk. But if we were to consider the uptrend that started from Jan 2013, then bullish sentiment would remain intact, as we are still trading around the peak of May 2013, with a break below 1,600 and preferably June lows in order to invalidate the YTD uptrend. Ichimoku indicator seem to agree, with price finding support along Senkou Span A instead of breaking into the Kumo. Stochastic readings are still pointing sharply lower, but we are currently nearing the Oversold region, with shallow troughs historically. Considering that support lines can also be sought above 1,640, it is possible that price may be able to dip slightly into the Kumo to hit 1,640 thereabouts, and subsequently rebound higher – probably in line with Stochastic readings dipping below 20.0 and setting up for a bullish cycle reversal.
Dow 30 Daily Chart
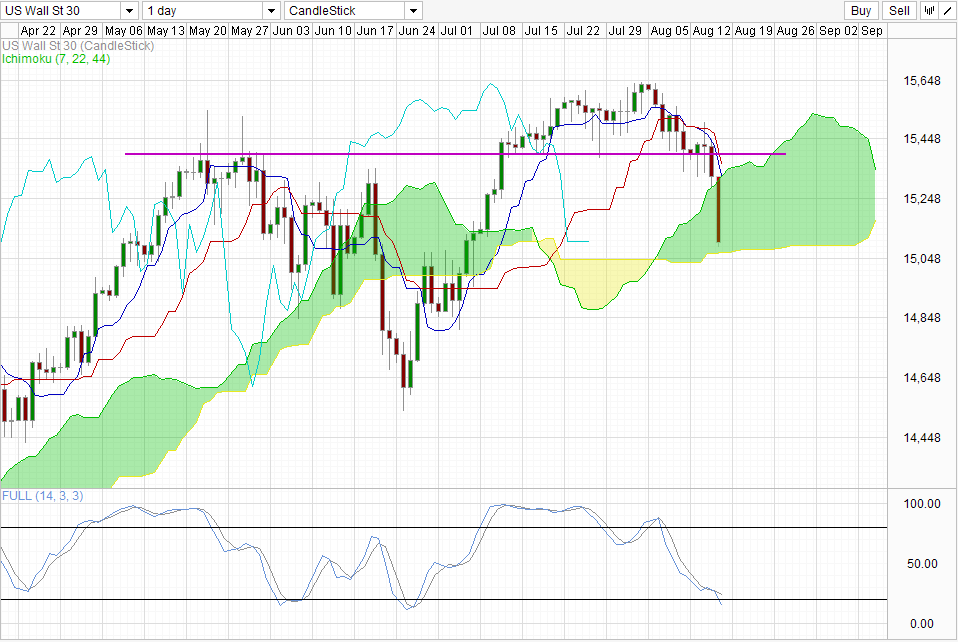
Dow 30 continue to look more bearish, with the next level of significant support coming in at 15,000 and the Senkou Span B slightly above that. Stochastic readings are currently just entering the Oversold region, and we could potentially see prices rebounding around 15,000 which would result in a bullish cycle signal coming out from the Stochastic indicator, as historical Stoch troughs are also fairly shallow, similar to those seen on the S&P 500 chart.
As S&P 500 and Dow 30 has strong correlation, despite the slight difference in bullish/bearish sentiment, a dip into Kumo by S&P 500 and perhaps even a break of 1,640 – 1,650 support will most likely result in a break of 15,000 for Dow 30. In similar vein, should Senkou Span B holds for Dow 30, prices may be able to climb higher on the rebound for S&P 500 from current Senkou Span A support.
More Links:
GBP/USD – Surges Strongly through 1.56 to Two Month High
AUD/USD – Retraces Strongly from Resistance at 0.92
EUR/USD – Surges through 1.33 and Looks to Resistance at 1.34
This article is for general information purposes only. It is not investment advice or a solution to buy or sell securities. Opinions are the authors; not necessarily that of OANDA Corporation or any of its affiliates, subsidiaries, officers or directors. Leveraged trading is high risk and not suitable for all. You could lose all of your deposited funds.

Mingze Wu
Latest posts by Mingze Wu (see all)
- European Bourses Not Enjoying Bullish Winds From US Stocks - 17 April 2014
- More Aggressive Stimulus Possible Despite Premier Li’s Denial - 17 April 2014
- China March FDI -1.5% Y/Y vs +2.05% expected. First decline in more than a year. - 16 April 2014