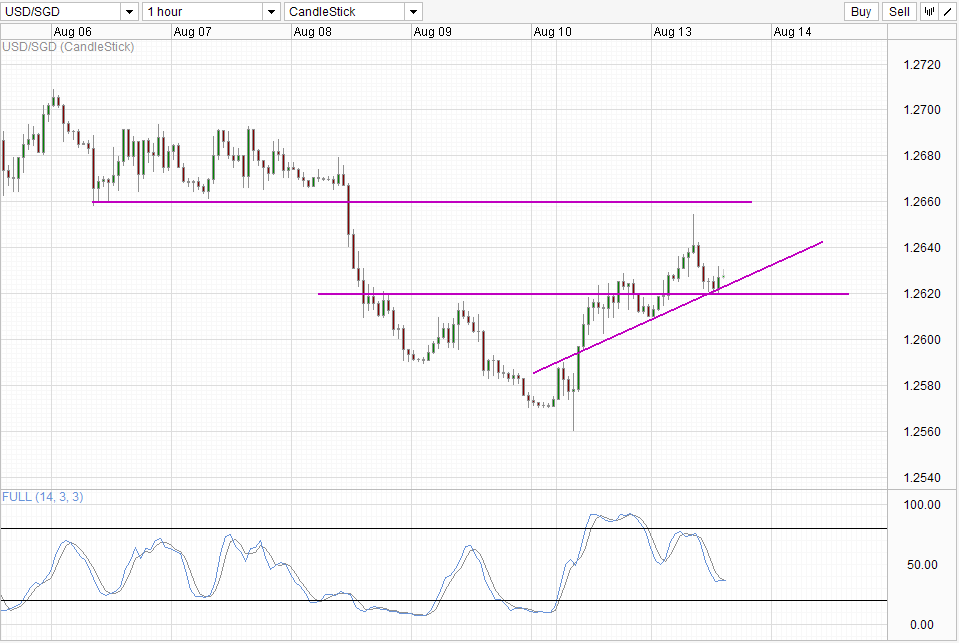
Price dipped below 1.262 briefly after trading above the resistance during European hours yesterday, but climbed back up after US midday trade, finding support around the 1.261 swing high of last Friday. Early Asian trade today saw USD/SGD pushing towards the 1.266 – 1.269 consolidation zone of 6th – 7th August, but ultimately falling short of reaching there. Price is currently finding support via 1.262, forming a new rising trendline to represent current rally this week.
Is there any reason for this continued rally? USD is marginally stronger D/D, gaining 0.32% against an equally weighted basket of the G10 currencies. Incidentally SGD has also rallied 0.31% during the same time period. Besides USD buyers, there are reports of institutional funds and models (algo traders) buying during the same rally, suggesting that we could be seeing longer-term rally of USD/SGD moving forward.
Hourly Chart
However, neither fundamentals nor technicals truly support the a long-term USD/SGD scenario. Lets start with the Fundamentals – Singapore’s economy remain robust based on yesterday’s better than expected GDP print. Even though there are some concerns regarding the downgrade of export forecast, full year GDP growth is still expected to be between 2.5% – 3.5%, perhaps closer to the lower than upper limit. Nevertheless, a more than 2.5% growth is still respectable, and perhaps even enviable looking at how the rest of the world is doing. Hence it is unlikely that SGD will collapsed quickly from here especially since Central Bank MAS is rather bent on keeping SGD on a mild appreciative curve in order to mitigate the high inflation rates.
On the technical side of things, prices does look possible to mount yet another attack on 1.266 with a rebound off the rising trendline/ 1.262 support. However, there is a divergence seen between this week’s price peaks vs Stoch peaks, which is disconcerting as it suggest that any pullback in prices may be stronger moving forward.
Daily Chart
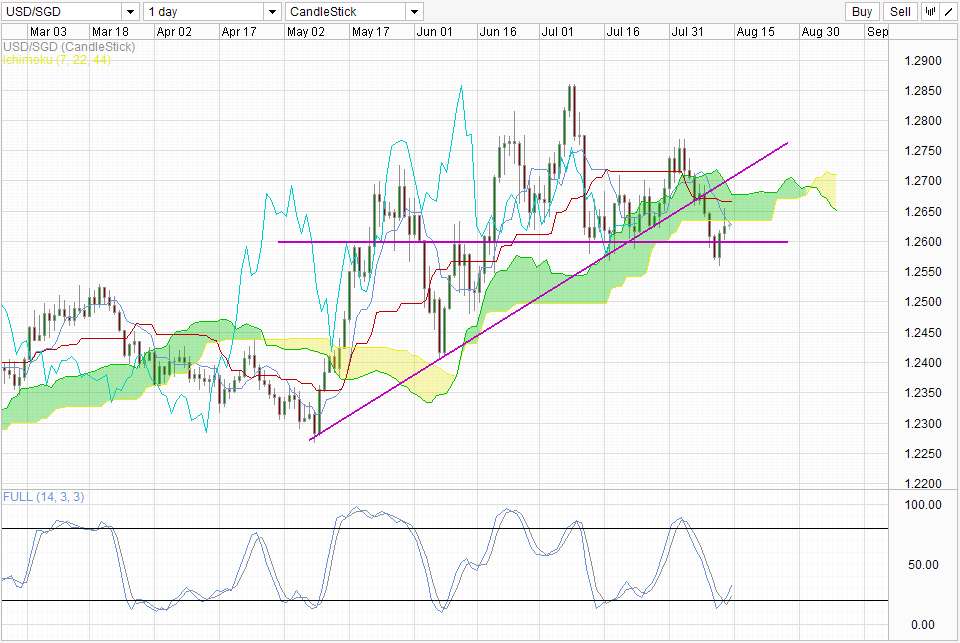
Looking at Daily Chart, we are seeing price heading towards the Senkou Span B just as Stochastic readings are showing the start of a bullish cycle. If Stochastic readings are reliable, we may see prices breaking into current overhead Kumo and press for Senkou Span A for a Kumo bullish breakout. However, forward Kumo is actually bearish, and even if price manage to clear the overhead Kumo, it is likely that 1.27 and also the underside of rising trendline will provide resistances against further rallies.
More Links:
WTI Crude – 106.0 Resistance Holding With 105.0 Eyed
AUD/USD – Undeterred By Worsening Business Confidence
GBP/USD – Looking back towards Key 1.54 Level
This article is for general information purposes only. It is not investment advice or a solution to buy or sell securities. Opinions are the authors; not necessarily that of OANDA Corporation or any of its affiliates, subsidiaries, officers or directors. Leveraged trading is high risk and not suitable for all. You could lose all of your deposited funds.

Mingze Wu
Latest posts by Mingze Wu (see all)
- European Bourses Not Enjoying Bullish Winds From US Stocks - 17 April 2014
- More Aggressive Stimulus Possible Despite Premier Li’s Denial - 17 April 2014
- China March FDI -1.5% Y/Y vs +2.05% expected. First decline in more than a year. - 16 April 2014