With all the rumors about Fed stopping or cutting QE purchases in 2013, it make sense to see US yields gaining higher, with the benchmark 10Y price falling below 131.0 and hitting 130.0 last week. However unlike Stocks that has been continuing trading lower this week, with Dow Jones closing below 15,000 yesterday, bond prices actually started bouncing higher, which means Yields are actually falling, with demand in 10Y gaining instead of losing.
Weekly Chart
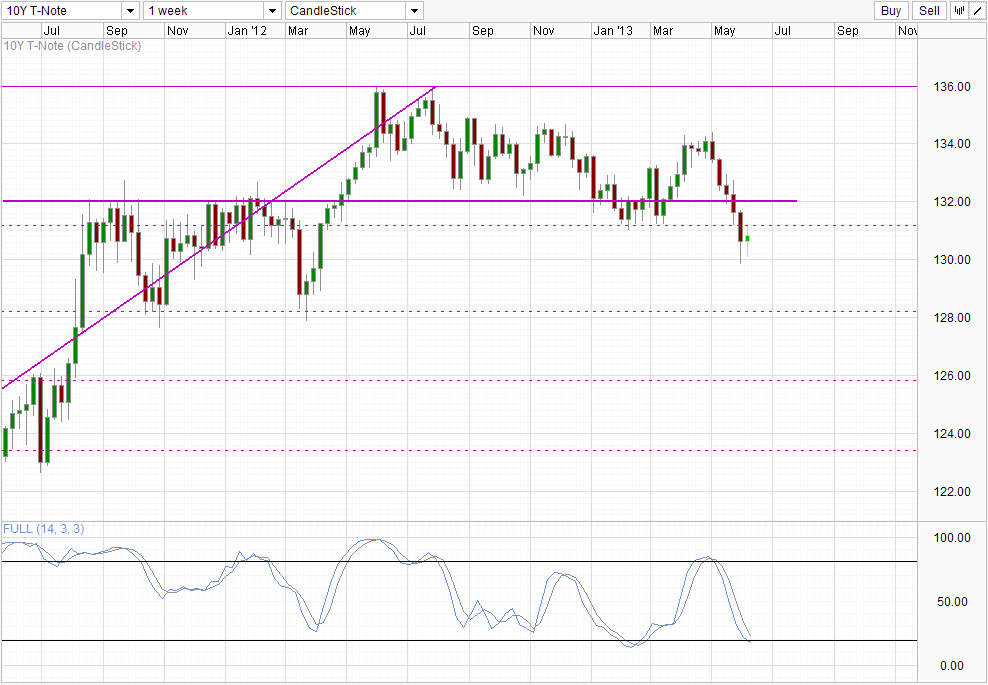
Well, the answer could be simply bond prices are facing a technical rebound currently after breaking the 131.0/confluence with 23.6% Fib retracement last week. Bond yields have been increasing for 5 consecutive weeks before the current one and it is not surprising to see a technical rebound of some sort before price can push lower towards 128/38.2% Fib retracement. There’s also a general belief that stocks tend to get the memo last, which means that the current 3 week slump in US stocks is merely lagging yields by 2-3 weeks.
One way to see if the above mentioned is actually true will be how yields react after NFP announcement tomorrow. If the stopping of QE remain the main driver for yields to fall, a stronger/better than expected print tomorrow will result in a dip in bond prices, and we could potentially see price heading towards 130.0 and perhaps even lower. The opposite will be true for a worse than expected NFP number.
From a technical perspective, price is currently in a bear leg from Jun 2012 highs. If bond price does hit 131 tomorrow but fail to break the level, additional bearish pressure will come in and an acceleration towards 128/38.2% Fib will be possible. Certainly a break of 131.0 is also plausible, but bulls will need to break 132.0 preferably in order to establish a bullish target for 134.0 and invalidate current bearish bias.
Hourly Chart
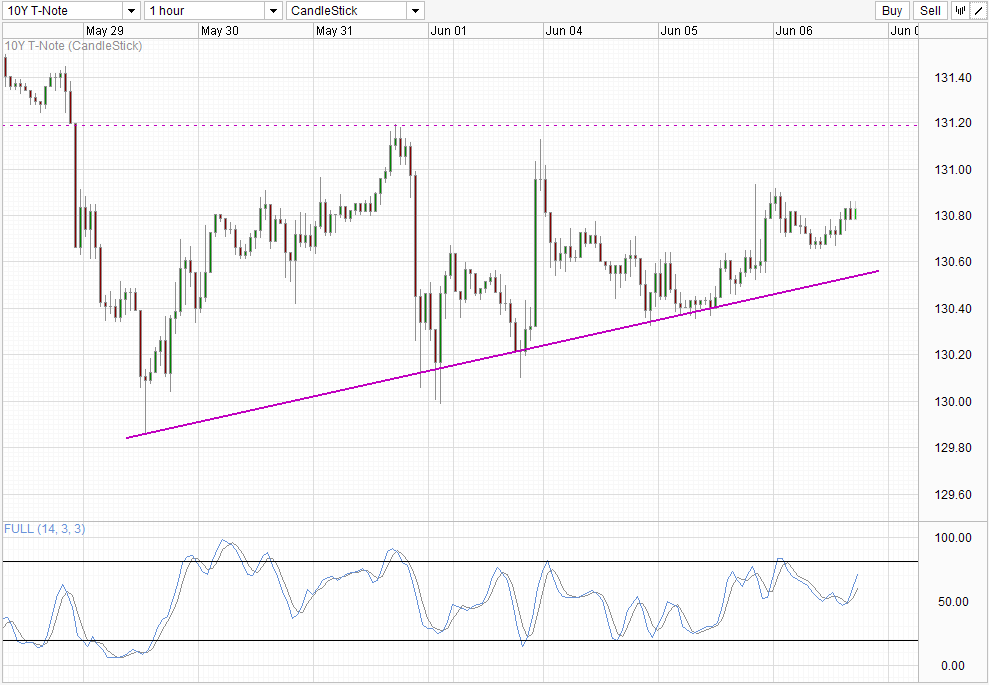
Hourly Chart shows price to be mostly stable, unlike yesterday’s free-falling for stocks. Looking at the short-term pressure, and using Stochastic as reference, it seems that price may be on its way to test 131.0 and perhaps even 131.20. However stochastic readings also suggest that a break of 131.2 may not be as likely, with readings already near the Overbought region which makes further advancement given the longer-term bearish outlook slightly harder.
More Links:
GBP/AUD Technicals – Bullish Breakout before BOE Decision
USD/JPY Technicals – 99.0 breaking, 98.5 under threat
GBP/USD – Moves to Four Week High at 1.54
This article is for general information purposes only. It is not investment advice or a solution to buy or sell securities. Opinions are the authors; not necessarily that of OANDA Corporation or any of its affiliates, subsidiaries, officers or directors. Leveraged trading is high risk and not suitable for all. You could lose all of your deposited funds.

Mingze Wu
Latest posts by Mingze Wu (see all)
- European Bourses Not Enjoying Bullish Winds From US Stocks - 17 April 2014
- More Aggressive Stimulus Possible Despite Premier Li’s Denial - 17 April 2014
- China March FDI -1.5% Y/Y vs +2.05% expected. First decline in more than a year. - 16 April 2014