Kiwi Dollar joined all the rest of the risk correlated assets lower yesterday due to increase fear in the market. Prices have been trading lower without any reply since 11th April top, with bulls barely making a whimper as pullbacks throughout the sell-off failed to retest any interim consolidation during the slide. Today’s rally from 0.838 to 0.848 is the first significant corrective rally that managed to hit the previous consolidation area, and should bulls manage to break higher, we could see bulls gaining foothold to negate some bearish pressure.
Hourly Chart
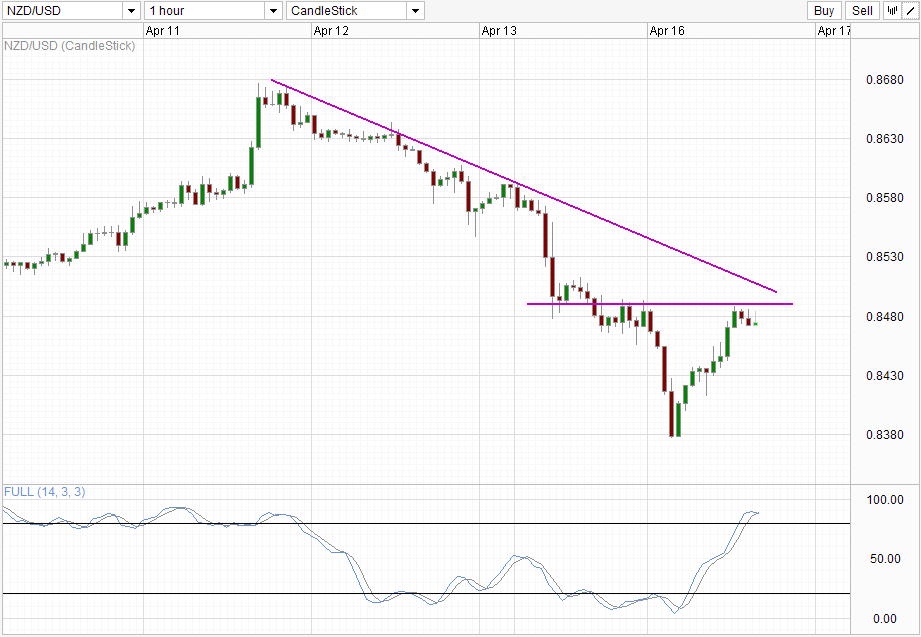
However, looking at the Hourly Chart, bulls may find it tough to be able to break above current resistances. Price barely touched the resistance line just below 0.850, and is still some distance away before testing the downward trendline, which represents current bearish momentum. Stochastic readings have also flattened instead of heading lower, threatening to break lower into a bearish cycle – certainly not what bulls would like to see. Furthermore, there appears to be a divergence between Stoch peaks and price peaks, which is a strong bearish signal as it implies that current recovery rally may be just a tad too fast/overextended, which means a bearish pullback from this recovery rally is also in the cards.
Daily Chart
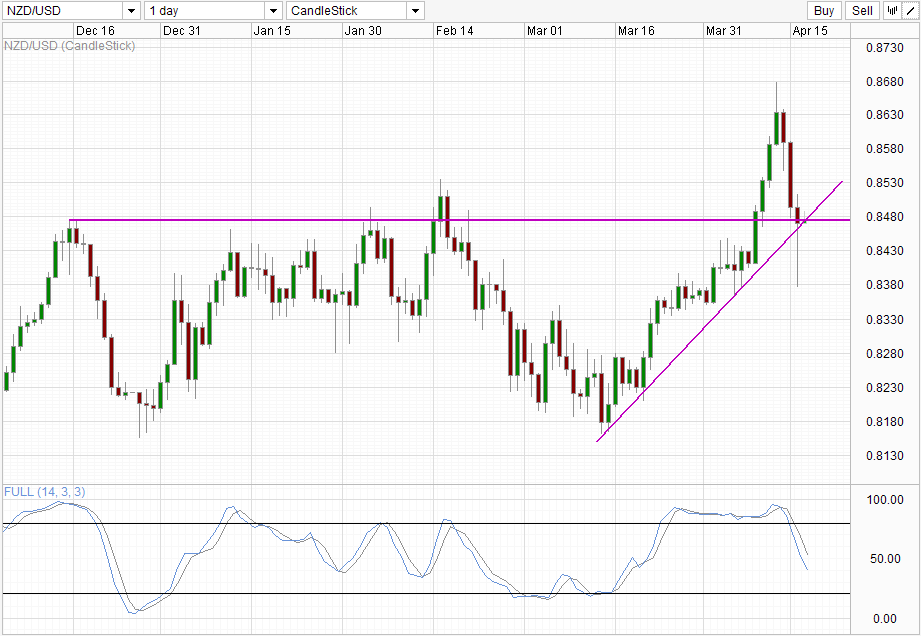
Daily Chart is more bullish, as price appears to be trading just above the intersection between the rising trendline and the support/resistance line that has been in play since 15th Dec 2012. If price remain trading above the intersection, current rally from Mar lows will still be intact, making a push back towards 0.868 possible. However the preciseness of both lines may be suspect as diagonal trendlines tend to have margin of errors (it’s not a precise science but an art drawing trendlines). A mere shift in 0.1 angular degree can result in the same price level trading above or below it. This issue is even greater especially when price is so close to the trendline currently (current candle covered by the intersection). As such, traders may wish to hold out longer for the trend to be more apparent either higher or lower rather than simply assuming that this trendline is golden and infallible. The same applies to the horizontal support/resistance that acts as a visual representation of price ceiling between Dec to Feb 2013. In reality, the price ceiling stretches to as low as 0.843 to as high as just above 0.853.
Stochastic readings do favor downsides though, with readings continuing current bear cycle. If Stochastic is proven to be correct, we could see price trading below current intersection and push towards 0.8330 support.
New Zealand CPI data scheduled to be released tomorrow will also help to guide prices in the short-term. If inflation come in stronger than expected, the threat of RBNZ Deputy Governor Spencer’s threat of rate hike will have a higher likelihood of materializing. Spencer did not mince his words during his latest public speech, saying that rate hikes are tools that RBNZ may employ should housing price continue to rally. On the other hand, if inflation rates are weaker than RBNZ’s expectation, the possibility of rate hikes will decrease greatly as it is unlikely that RBNZ will risk jeopardizing NZ economic growth further with drought ravaging production levels across the Northern region. Whether this CPI print have long lasting influence on NZD/USD is debatable, but certainly it will impact NZD/USD direction when it is teetering to breakout on either side.
More Links:
USD/JPY Technicals – 96.6 vs 97.6
AUD/USD – RBA Minutes indicate scope to ease (again)
GBP/USD – Consolidates Below 1.53
This article is for general information purposes only. It is not investment advice or a solution to buy or sell securities. Opinions are the authors; not necessarily that of OANDA Corporation or any of its affiliates, subsidiaries, officers or directors. Leveraged trading is high risk and not suitable for all. You could lose all of your deposited funds.

Mingze Wu
Latest posts by Mingze Wu (see all)
- European Bourses Not Enjoying Bullish Winds From US Stocks - 17 April 2014
- More Aggressive Stimulus Possible Despite Premier Li’s Denial - 17 April 2014
- China March FDI -1.5% Y/Y vs +2.05% expected. First decline in more than a year. - 16 April 2014