Crude oil traded higher during Asian hours after getting an absolute beating during US trading hours yesterday. All in all, price has declined more than $10 USD per barrel since the start of April due to a combination of demand concerns, oversupply in US side, and now the latest bearish drive due to Gold’s spectacular fall push black gold further lower, breaking 100.0 per barrel and almost reaching $98.0 during early off-market hours. However, common knowledge tells us that what goes up must come down, and the reverse is no less true. Prices rebounded from the lows and now we’re right back around $100.0 psychological significant round number once more.
Daily Chart
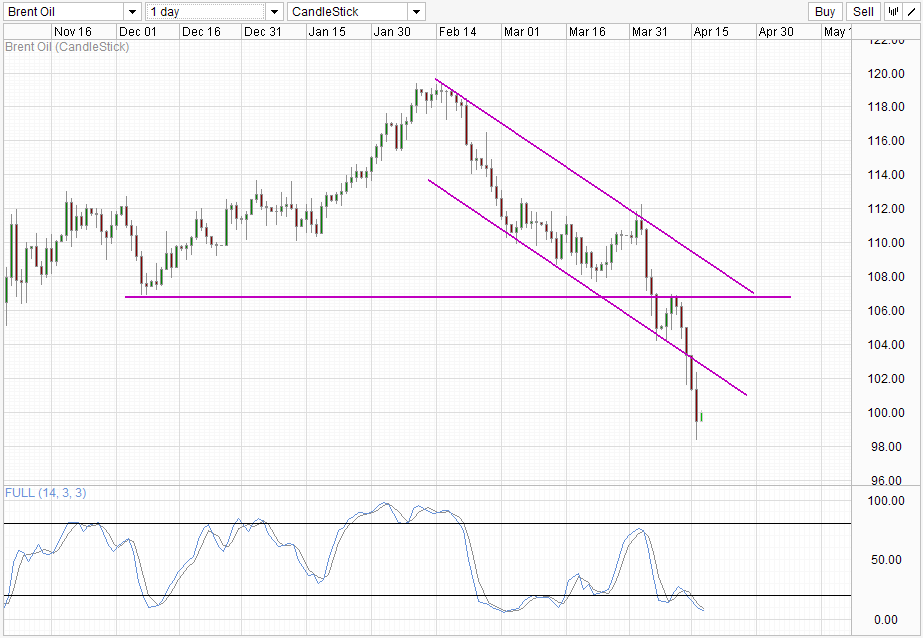
From the Daily Chart, it is hard to see 100.0 providing significant guidance. The last time 100.0 played a big part in directing price was in early July 2012 (not shown in chart), and even back then, 100.0 was simply in the middle of the July consolidation rather than providing any support/resistance. It seems that 100.0 has been easily shoved apart against strong trends in the past, and perhaps we should not be placing too much emphasis on its resistance strength this time round.
Instead, 102.5 may provide stronger resistance. This level is the confluence of the Channel Bottom and the aforementioned July consolidation ceiling. Stochastic readings is threatening to make a upward turn, but currently there is still some distance between current Stoch/Signal lines, which suggest that price could still head lower before a more significant pullback occurs. Another alternate scenario may see price moving higher towards 102.5 and break into the descending Channel. In this scenario, it is likely that Stoch readings may also be clearing the 20.0 level, signalling the start of a bull cycle just as price look poise to test Channel Top.
Hourly Chart
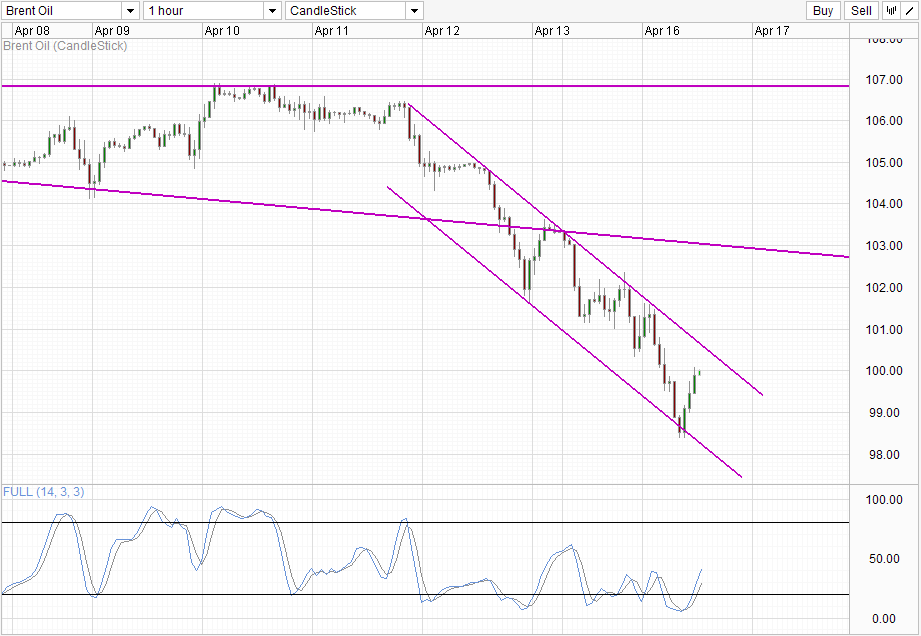
The testing of Channel top is currently underway in the Hourly Chart, with its own downward descending Channel. Price is moving in the direction towards 100.50 which is the confluence between recent swing low on 15th April and the Channel Top corresponding to current momentum. Stochastic readings are also pointing higher, which will help price to test the 100.50 level, though it remains to be seen whether momentum will be strong enough to break the Channel Top. Failure to break Channel top may result in swift reply from the bears which will send prices back lower quickly towards Channel bottom, below 100.0 and potentially a test of 98.0 proper.
Fundamentally, it is worth noting that Oil prices have been dropping when US stocks have been rallying. Yesterday saw US Stocks unraveling greatly catalyzed by the Gold’s sell of, and yesterday’s bombing of Boston Marathon within US shores added more stress and fears into the market. This will pull Crude even lower and potentially result in even greater acceleration downwards.
More Links:
Gold Technicals – Largest Decline since 1980 sends gold just above 1,325
Gold Bears Mission Accomplished: Is the EUR next?
AUD/USD – RBA Minutes indicate scope to ease (again)
This article is for general information purposes only. It is not investment advice or a solution to buy or sell securities. Opinions are the authors; not necessarily that of OANDA Corporation or any of its affiliates, subsidiaries, officers or directors. Leveraged trading is high risk and not suitable for all. You could lose all of your deposited funds.

Mingze Wu
Latest posts by Mingze Wu (see all)
- European Bourses Not Enjoying Bullish Winds From US Stocks - 17 April 2014
- More Aggressive Stimulus Possible Despite Premier Li’s Denial - 17 April 2014
- China March FDI -1.5% Y/Y vs +2.05% expected. First decline in more than a year. - 16 April 2014