Gold suffered the largest 2 day fall in 33 years as 2012 lows were broken with current prices testing 2011 lows. The sell-off was sparked last Friday due to a reported huge sell-order to the tune of around 125 tonnes worth about $6 billion USD initiated by a large investment bank. Whether the orders was done for the bank’s prop position or requested by client (or clients) are unknown, but it certainly spooked market enough for the sell-off to occur. Fundamentally, sentiments about Gold was already on the verge of a bearish tipping point due to demands from ECB requesting Cyprus to clear almost all its Central Bank gold reserves to make good of their bailout shortfall. This resulted in traders and speculators fearing that supply in gold will increase tremendously in a market where demand is scarce with QE3 threatening to slow down, and stocks clearing all time highs in the previous week.
Weekly Chart
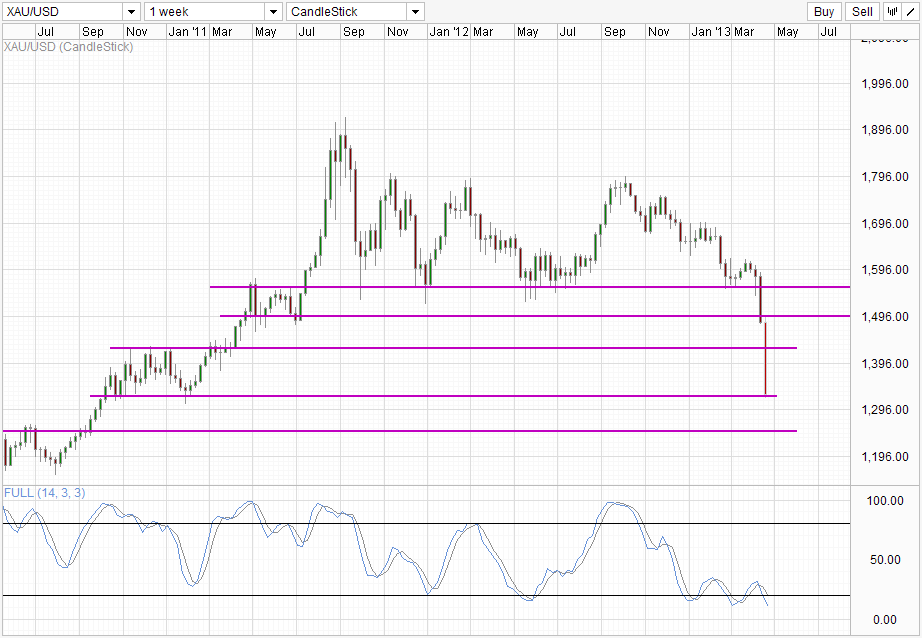
Weekly chart shows the degree of the decline. Prices have managed to cleared numerous milestones in mere 2 days, with current support around Sep ’10 – Jan ’11 consolidation area providing some interim support for bears to catch a break. The overall trend is bearish starting from the stochastic divergence seen back from Sep ’12, which also happens to be the onset of current bear trend. Bearish momentum picked up with the first break of 2012 floor, while further acceleration taking place when 1,500 support was broken.
Ok, so trend is heavily bearish, what does that mean for me? Should I buy or sell right now?
Generally, trend traders will advice others not to trade against the current trends. This is despite the fact that we all know that eventually there may be a technical rebound (dead cat bounce) sooner or later. The main reason against trading the bounce is that such bounces could be quickly eroded especially if sentiments remain firmly entrenched towards the trend direction. E.g. traders will find a pullback price attractive to sell into given current situation. Does that mean that traders should simply sell right here right now after knowing that a long-term bear trend is currently underway? Certainly not as well, because you may still be caught by the same technical rebound mentioned earlier.
So where does that leave us?
15 Minutes Chart
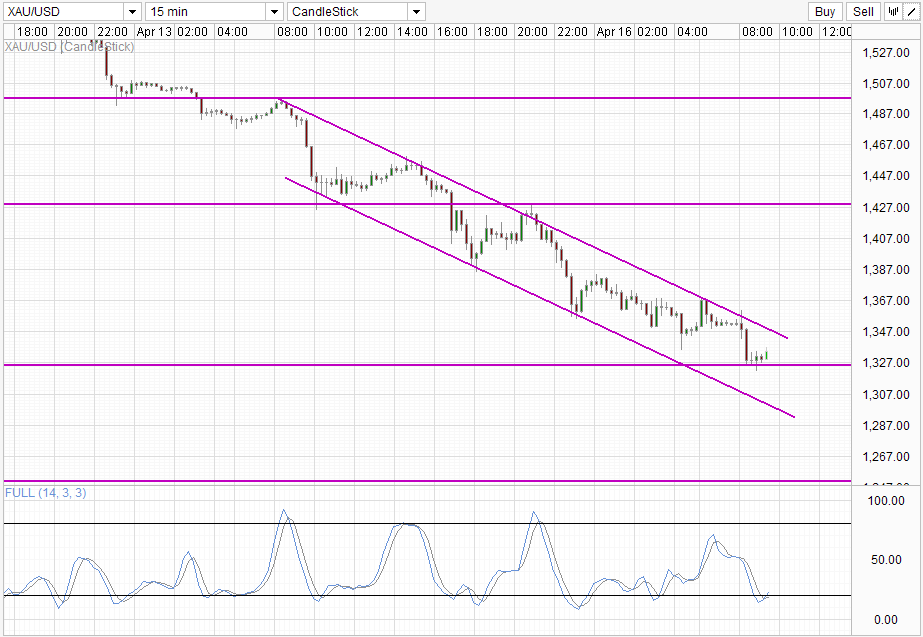
Using shorter-termed charts, longer term traders may be able to find valuable entries into current bear trend. Currently price is trading within the downward channel, with Stochastic readings shows that price are oversold with a bullish cycle potentially underway. Traders can look for any exhaustion of bullish pullbacks to identify good prices to re-enter the bear trend. However, caution must be exercised to ensure that pullbacks have confirmed to have stalled to prevent early sell entries into a proper bullish reversal. In current context, bullish pullbacks could potentially find resistance via Channel Top, Consolidation between 1,347 – 1,367, or Stochastic readings hitting Overbought.
More Links:
AUD/USD – Drops Sharply to Touch Below 1.03
EUR/USD – Eases Away from the Key 1.31 Level
Gold Bears Mission Accomplished: Is the EUR next?
This article is for general information purposes only. It is not investment advice or a solution to buy or sell securities. Opinions are the authors; not necessarily that of OANDA Corporation or any of its affiliates, subsidiaries, officers or directors. Leveraged trading is high risk and not suitable for all. You could lose all of your deposited funds.

Mingze Wu
Latest posts by Mingze Wu (see all)
- European Bourses Not Enjoying Bullish Winds From US Stocks - 17 April 2014
- More Aggressive Stimulus Possible Despite Premier Li’s Denial - 17 April 2014
- China March FDI -1.5% Y/Y vs +2.05% expected. First decline in more than a year. - 16 April 2014