Prices has been making W/W gains ever since the bullish breakout at the start of the year, though body of the candles have been shortening, givng us a thin dragonfly doji last week. A main reason of the decrease in bullish momentum can be attributed to uncertainty over Aussie dollar, which saw AUD/USD falling from 1.06 high to a 1.04 low last week. This is further compounded last week when speculators and traders alike took profit of their short Yen positions after BOJ’s announcement, which weighed on all Yen crosses for a few days before Yen weakness took hold again.
Despite the uncertainty over RBA and weakening economy, AUD/USD managed to stay above 1.04 and pushed off from there, giving AUD/JPY a new lease of bullish momentum late last week, and barely sustaining the W/W gain streak.
Weekly Chart
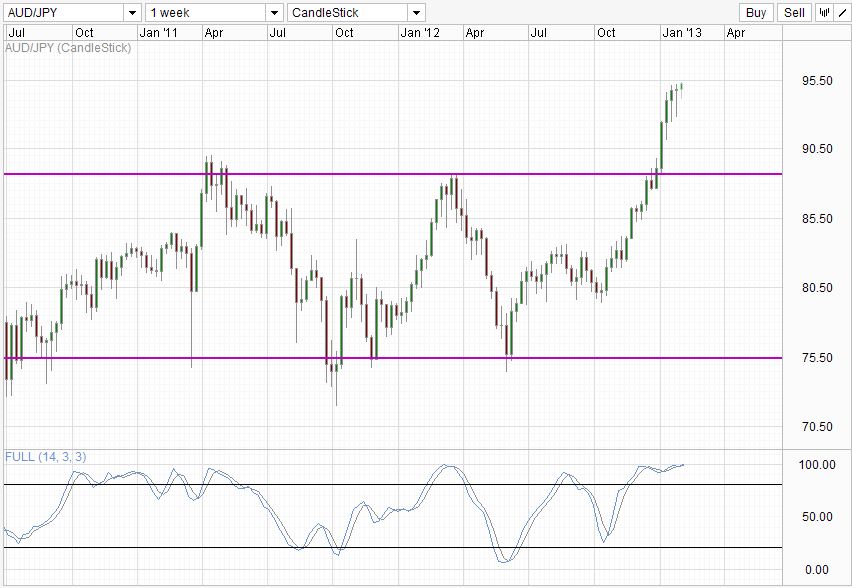
Doji generally imply uncertainty, not necessary reversal, and bulls will be glad that the likelihood of AUD/JPY closing with a Green candle is higher should all things remain the same. Body of current candle is also longer than last week, which is certainly a good sign for traders hoping that the bull trend will continue.
Fundamentally, concerns over RBA rate cuts will continue to weigh on all AUD pair, which will come to light next week, potentially giving us a better indication of how much further AUD/JPY may go. On JPY side, seasonality could also be helping JPY weakness as we approach the last 1-2 months of FY 2012 for the Japanese. Abe and various BOJ Board members continue to be dovish, seeking “bold” and “strong” actions – whatever that may mean – to further weaken the Yen. JPY crosses are no longer riding on economic fundamentals but simply on promises of things to come, a common market reaction/expectation that is used by Bernanke and Draghi alike.
2 Hourly Chart
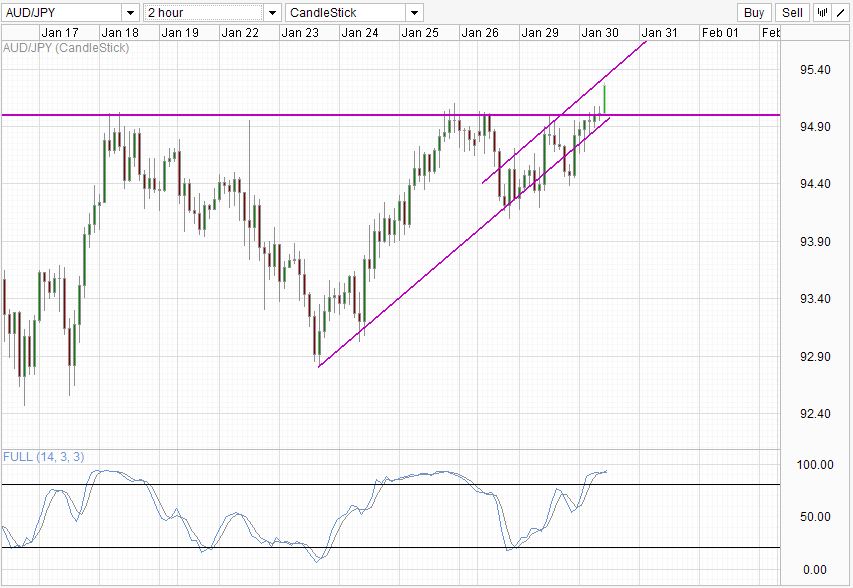
Even when AUD downside has been taken into consideration, likelihood of AUD/JPY climbing higher remains high, both from a technical and fundamental point of view. However, long-term bullishness does not translate into good short-term entries, and traders could still find bargain prices on dips. The weekly bullish breakout is well on its way, but from the 120 mins chart, we can see a new bullish breakout is starting with the recent break of 95.0. As price approach Channel Top, look for any potential pullbacks to 95.0 for a confirmation of bullishness should 95.0 holds. Price could also find support along Channel bottom which is on its way to cross 95.0 as we speak.
More Technical Analysis:
EUR / USD – Making a Play for 1.35
This article is for general information purposes only. It is not investment advice or a solution to buy or sell securities. Opinions are the authors; not necessarily that of OANDA Corporation or any of its affiliates, subsidiaries, officers or directors. Leveraged trading is high risk and not suitable for all. You could lose all of your deposited funds.
Latest posts by marketpulsefxstaff (see all)
- Oil Remains Near Multi-Month Lows - 6 August 2015
- U.S. Dollar Higher on Recent Data - 6 August 2015
- Greece’s PM Tsipras: Loan Deal with Lenders Close - 6 August 2015