Santa Claus has apparently brought USD/HKD into his sleigh back to the North-Pole, with USD/HKD continuing to rise steadily after Christmas 2012. Though price is just a tiny fraction higher since then – 0.645% higher to be exact, one cannot deny the slow and steady direction of USD/HKD.
Hourly Chart
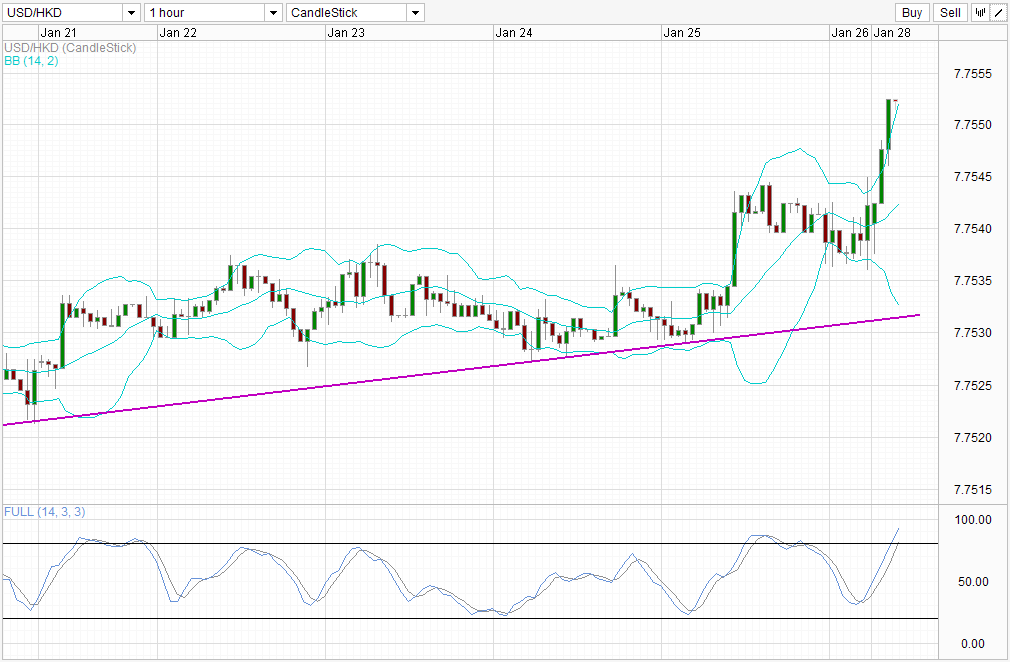
Hourly chart showed price climbed from a low of 7.7536 to 7.7552 since market opening this week – an incredible rally considering that the Hourly ATR 14 is slightly above 2 pips. The degree of the rally can also be felt using Bollinger bands, with current hourly candle body poised to open and close outside the top band.
This leads us to the questions that all traders would ask – will the rally continue from here or will we see a crash? To better answer that question, it is important to note that the current rally for the past few hours is not fundamentally driven by any economic news releases, but instead coincide with an unexplained strengthening of USD which has also moved traditionally sticky currencies such as USD/SGD (+0.03%) and USD/CNY (+0.04%). Comparatively, USD/HKD only moved +0.02% during the same period, while the most liquid currency pair EUR/USD fell 0.15% on the same USD strength. Hence it leads to the belief that current USD/HKD rally may not be repeating itself anytime soon, but does this equate to a crash? Though the scenario of speculators gunning for HKMA’s 7.75 floor shouldn’t be ignored, USD/HKD has been rising steadily at an average rate of 1.7 pip daily. Short-traders anticipating a pull-back may receive a rude shock when prices do not retrace as much as they want due to the low ATR, with a slow rising bias potentially clearing the pullback within 1-2 days.
Daily Chart
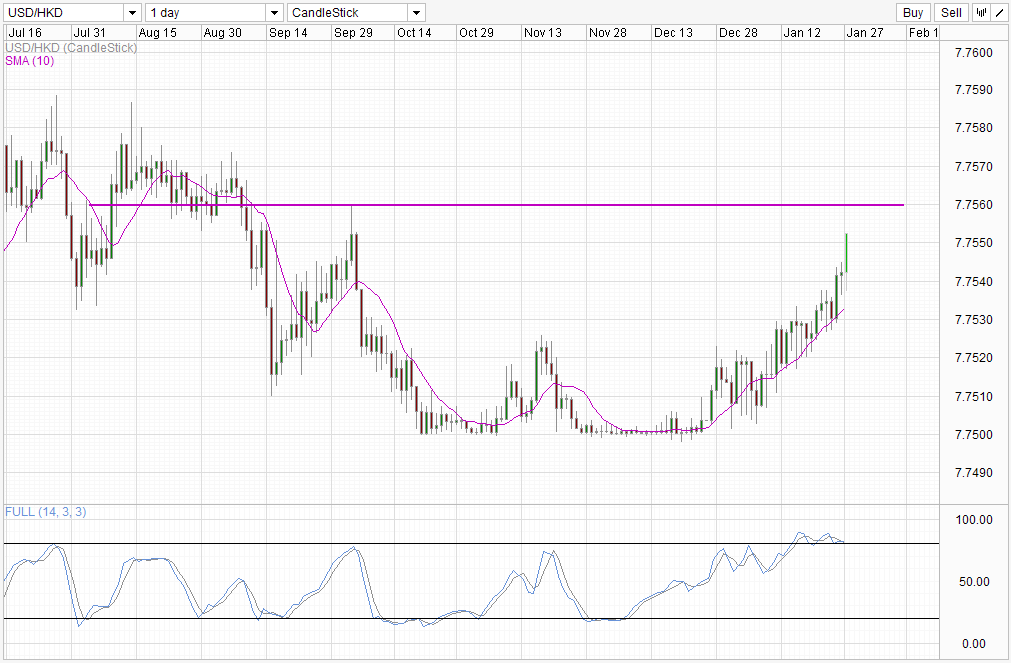
Daily Chart shows SMA 10 supporting the rise since Christmas. Overhead resistance can be seen around 7.756 which has been acting as a support back in Aug 2012 and the previous swing high in October 2012. We have also cleared the 7.754 swing low back in early Aug 2012, with current prices looking to test the overhead resistance mentioned previously.
This article is for general information purposes only. It is not investment advice or a solution to buy or sell securities. Opinions are the authors; not necessarily that of OANDA Corporation or any of its affiliates, subsidiaries, officers or directors. Leveraged trading is high risk and not suitable for all. You could lose all of your deposited funds.
Latest posts by marketpulsefxstaff (see all)
- Oil Remains Near Multi-Month Lows - 6 August 2015
- U.S. Dollar Higher on Recent Data - 6 August 2015
- Greece’s PM Tsipras: Loan Deal with Lenders Close - 6 August 2015