Hourly Chart
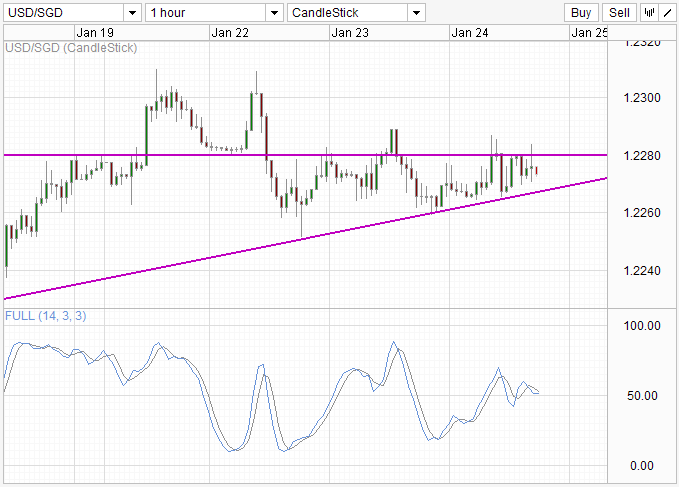
Even after 3 major events – 1) US House pushed Debt Limit back 2) Apple stock causing US market to drop 3) Chinese PMI better than expected – USD/SGD barely moved out of the 20 pip consolidation range between 1.226 to 1.228. 1.228 proved to be a tough nut to crack, though lows are steadily getting higher with each minute push, forming a triangle in the process. Looking at the economic news docket, we have US NFP and ISM Manufacturing that could hopefully jolt some life into this pair. Between now till next Friday, keep a watch on the Triangle as the apex draws nearer. Preferably we could see prices breaking out of the Triangle, with next Friday’s data providing the confirmation/additional push for the breakout.
Weekly Chart
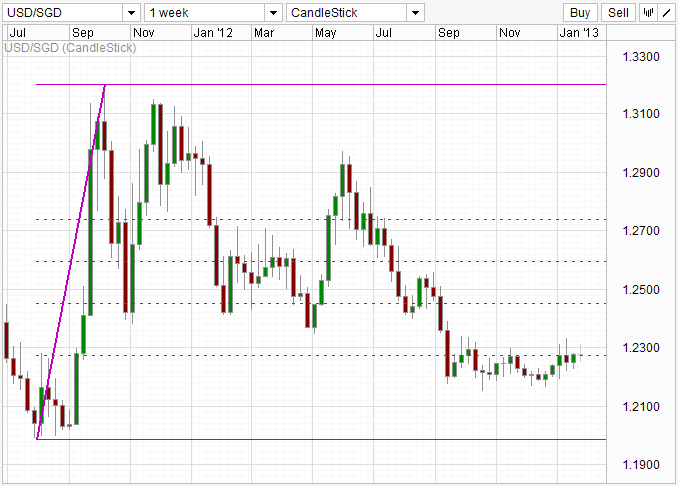
1.228 is the confluence of 61.8% Fib (Aug 2011 High vs Oct 2011 High). After trading below the Fib line, price has failed to move towards the 100% retracement level, instead straddling between 1.218 and 1.228 for an extended period of time. Overall the bearish momentum has stalled, but the bullish sentiment is not obvious. With price sitting just below the Fib now, short-term breakouts can hopefully translate to larger volatility on the weekly chart.
This article is for general information purposes only. It is not investment advice or a solution to buy or sell securities. Opinions are the authors; not necessarily that of OANDA Corporation or any of its affiliates, subsidiaries, officers or directors. Leveraged trading is high risk and not suitable for all. You could lose all of your deposited funds.
Latest posts by marketpulsefxstaff (see all)
- Oil Remains Near Multi-Month Lows - 6 August 2015
- U.S. Dollar Higher on Recent Data - 6 August 2015
- Greece’s PM Tsipras: Loan Deal with Lenders Close - 6 August 2015