Orders for Taiwan’s exports grew 8.5% in Dec from a year earlier. Orders from Europe jumped 25.1 per cent Y/Y, versus Nov 9.5% growth, which is a pleasing turn of events from the crisis-zone. On the flip side, Chinese and American orders grew at a slower rate, hinting at potential sluggish growth in Q1 2013. Though December is traditionally a slower month due to retailers taking a break from the Christmas season stocking up (generally peak between September to November), the declining rate of growth of China, who is gearing itself for the Chinese New Year celebrations is a major concern. Despite publishing surprisingly high export/import figures in the latest release, many analysts continued to be bearish about Chinese “real” growth, being skeptical of the perennial “optimistic” Chinese Government.
At their last meeting, the Central Bank of Taiwan (CBC) kept rates steady, citing an improved outlook in 2013 as underlying reasons for holding rates. However, should Q1 2013 economic data decline, we could see added scope for CBC to slash their rates which has been held since June 2011.
Weekly Chart
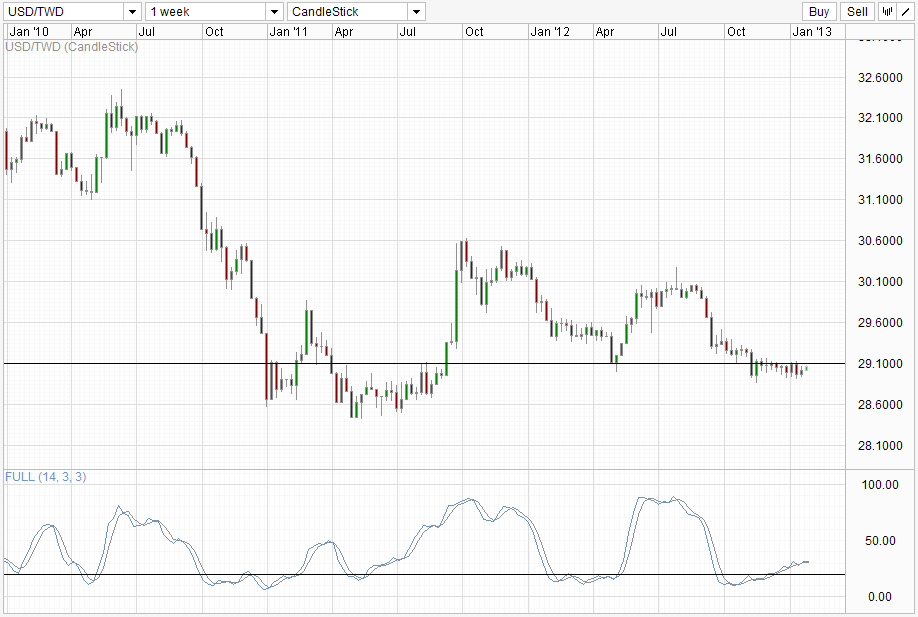
TWD has rallied significantly against the USD since Sep 2012, pushing price towards the 29.1 support and eventually breaking it. We are currently trading back just under the 29.1 line, with Stochastic reading suggesting that a bullish run may be on its way. However, should price failed to break 29.1, expect strong bearish sentiment to follow with the failed Stochastic signal acting as a monkey on its back to enhance bearish pressure.
Daily Chart
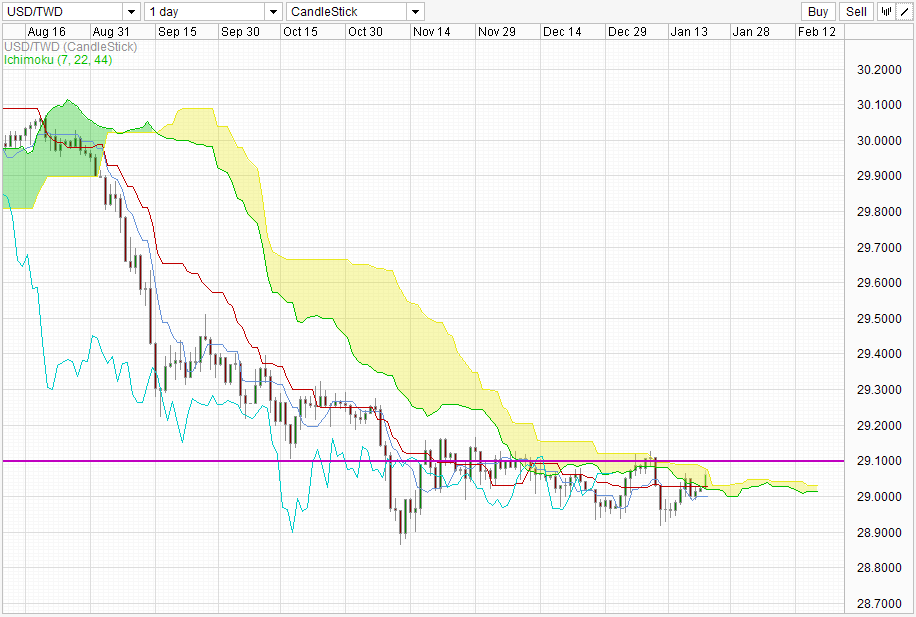
Price on the daily chart is trading right into the Kumo which has thinned. We are also looking at a potential Kumo Twist signal in the works, with current price looking likely to trade above the Kumo for a sign of bullishness. However, be aware that we could still see price rebounding back from 29.1 which could lead us back below the Kumo for a confirmation of bearish sentiment. Overhead resistances can be found along 29.2, 29.3 and 29.5 while support can be found on 29.0 and 28.9.
This article is for general information purposes only. It is not investment advice or a solution to buy or sell securities. Opinions are the authors; not necessarily that of OANDA Corporation or any of its affiliates, subsidiaries, officers or directors. Leveraged trading is high risk and not suitable for all. You could lose all of your deposited funds.
Latest posts by marketpulsefxstaff (see all)
- Oil Remains Near Multi-Month Lows - 6 August 2015
- U.S. Dollar Higher on Recent Data - 6 August 2015
- Greece’s PM Tsipras: Loan Deal with Lenders Close - 6 August 2015