4 Hourly Chart
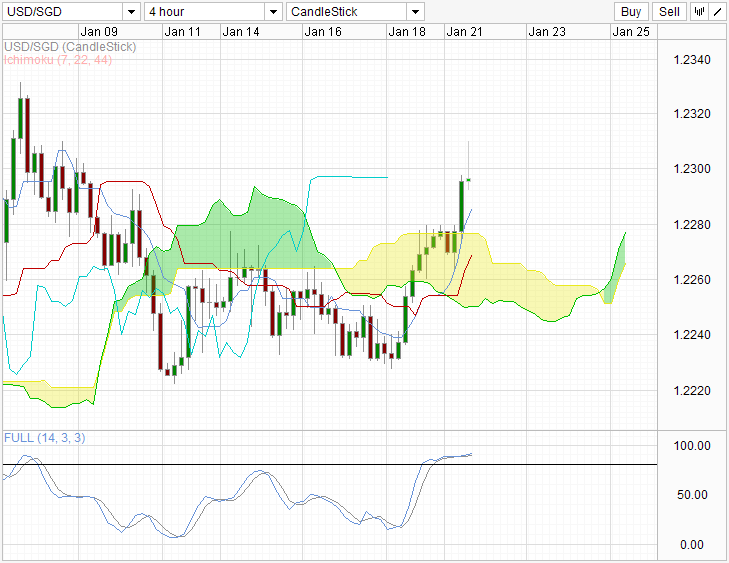
Following the bullish Kumo Twist, SGD has finally pushed above the Kumo convincingly. Besides this, price is also trading above the Chikou Span (cyan line), though price has pulled back a little after hitting 1.23. Stochastic reading is also in the Overbought region, hinting that a bear cycle may follow soon. Keep a keen lookout for price action around the 1.23 for any indication of confirmation of what Ichimoku is telling us, or what the Stochastic is indicating.
Weekly Chart
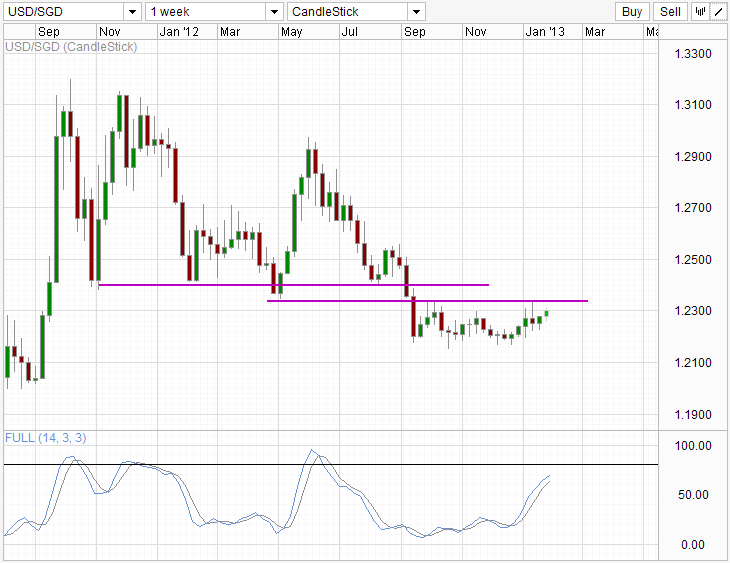
Stochastic of the weekly chart seems to agree with a more bearish scenario in the long run. However, shorter term remain bullish with room for current rally to move up towards 1.233 and 1.24 respectively (purple lines). Should prices hit the resistance band marked by the 2 aforementioned levels, stochastic readings should coincide with an entry into the Overbought region, setting us up to look out for a bearish confirmation. Using the 2 charts, one can see reasons for a short-term rally, but certainly traders will be entering at their own risk with longer trends still firmly heading lower without signs of exhaustion.
This article is for general information purposes only. It is not investment advice or a solution to buy or sell securities. Opinions are the authors; not necessarily that of OANDA Corporation or any of its affiliates, subsidiaries, officers or directors. Leveraged trading is high risk and not suitable for all. You could lose all of your deposited funds.
Latest posts by marketpulsefxstaff (see all)
- Oil Remains Near Multi-Month Lows - 6 August 2015
- U.S. Dollar Higher on Recent Data - 6 August 2015
- Greece’s PM Tsipras: Loan Deal with Lenders Close - 6 August 2015