Hourly Chart
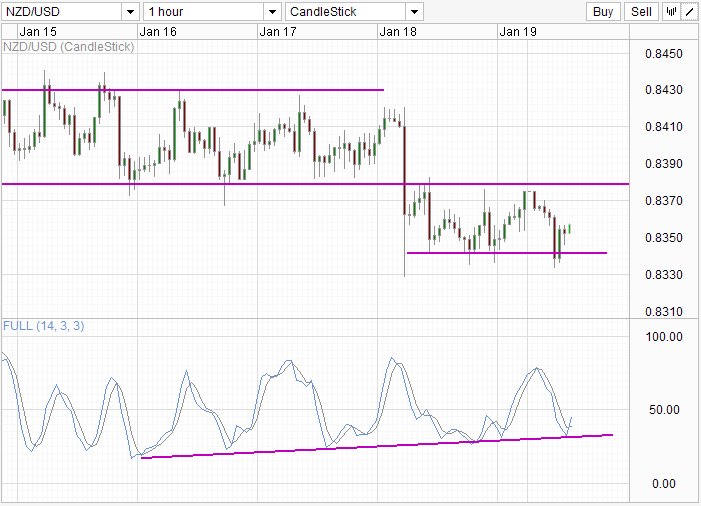
A new trading range has been established between 0.833 to 0.838. This channel is just below the similar 50 pip trading range that was in-force during early previous week between 0.838 – 0.843. Stochastic readings have been showing higher troughs, despite price heading lower during the same period. This divergence between Stoch readings and price levels suggest further bearish break, potentially in similar 50 pip steps which we’ve observed recently.
Daily Chart
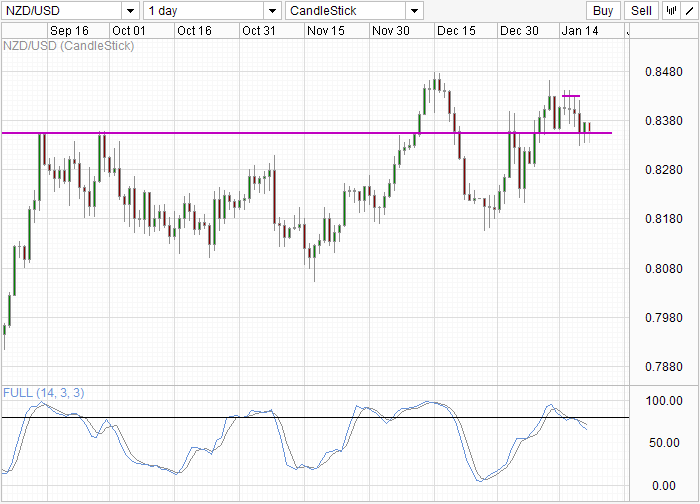
Daily Chart also has a bearish bias with price trading below the long-term resistance/support of 0.835. Do note that 0.835 is simply a reference here rather than a “clean” line in the sand. In fact, the entire band between 0.833 to 0.838 can be considered a resistance band. Hence when using this for trading decision, it may be prudent to use further confirmations and other price action behaviors to confirm if a bullish “bounce” or a bearish breakout is underway.
Using Stochastic, readings are falling back under 80.0, signalling that the bullish cycle has ended. A confirmation of 0.835 break may bring bearish acceleration towards 0.828-0.83, 0.818-0.82, and finally 0.808-0.81 as support zones.
This article is for general information purposes only. It is not investment advice or a solution to buy or sell securities. Opinions are the authors; not necessarily that of OANDA Corporation or any of its affiliates, subsidiaries, officers or directors. Leveraged trading is high risk and not suitable for all. You could lose all of your deposited funds.
Latest posts by marketpulsefxstaff (see all)
- Oil Remains Near Multi-Month Lows - 6 August 2015
- U.S. Dollar Higher on Recent Data - 6 August 2015
- Greece’s PM Tsipras: Loan Deal with Lenders Close - 6 August 2015