Hourly Chart
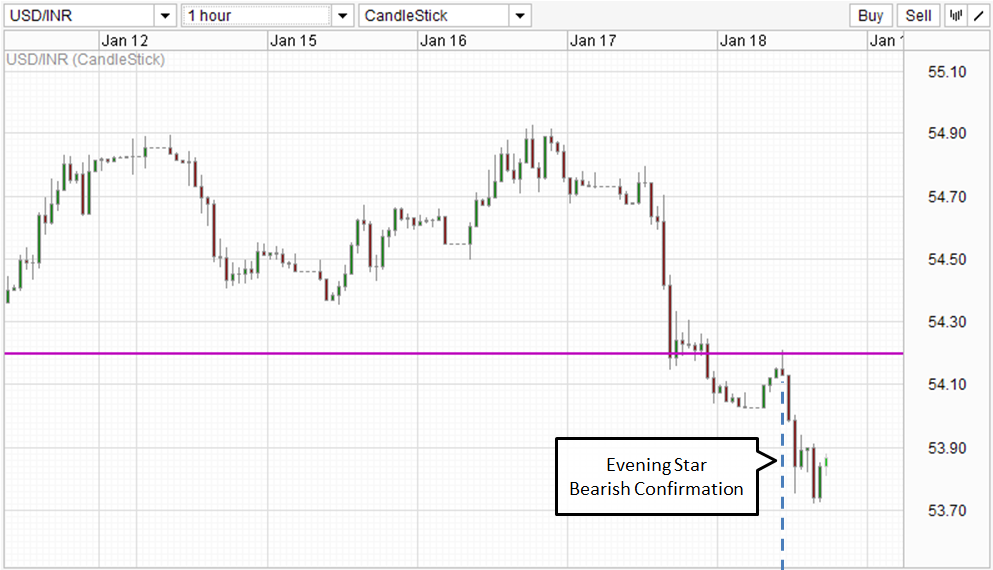
Indian Rupee continued strengthening on the day SENSEX gapped higher above 20,000 mark. As we approach the close of the week, SENSEX looks on track to close above the psychologically important level, keeping USD/INR depressed.
Price has crossed over the 54.20 support and formed an Evening Star candlestick pattern just below the support turned resistance, highlighting the strength of INR and hinting of further gains for INR.
Weekly Chart
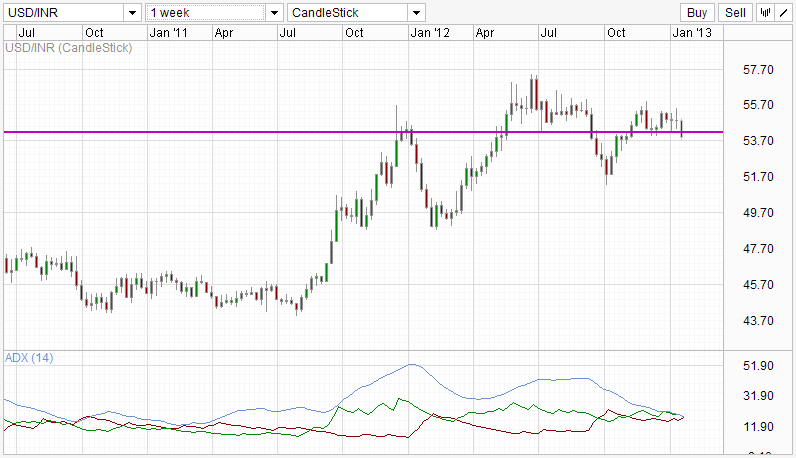
The 54.20 support/resistance is also observable via the weekly chart, hinting at a potential breakout. -ve and +ve lines of the Weekly ADX indicator looks to be crossing, indicating a potential sell signal in the works. ADX line is also decreasing back to the Jul ’11 levels, where prices was consolidating just before the strong rally from 45.7 to a high of 55.7 in Dec ’11. Breakout traders would enjoy this potential setup, because breakouts tend to be stronger after a long extended period of consolidation. If technical indications proved to be right, we could see a potential sell-off with a magnitude rivaling the rally from 45.70 to 57.7. Support can be found below around 51.70 and 48.70, with 44.7 – 45.7 being the ultimate target to bring price back in a full arc.
This article is for general information purposes only. It is not investment advice or a solution to buy or sell securities. Opinions are the authors; not necessarily that of OANDA Corporation or any of its affiliates, subsidiaries, officers or directors. Leveraged trading is high risk and not suitable for all. You could lose all of your deposited funds.
Latest posts by marketpulsefxstaff (see all)
- Oil Remains Near Multi-Month Lows - 6 August 2015
- U.S. Dollar Higher on Recent Data - 6 August 2015
- Greece’s PM Tsipras: Loan Deal with Lenders Close - 6 August 2015