Hourly Chart
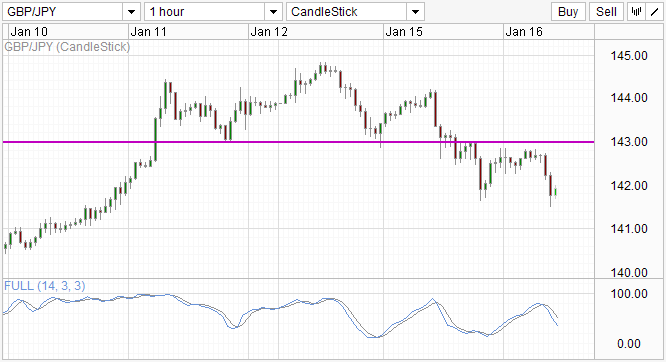
1st sign of weakness from GBP/JPY? Head and Shoulders pattern discussed yesterday appears to be confirmed with price rally back towards 143.0 but failing to cross back to the upper-side. Current price is trying to hold onto 142.0 after hitting lower earlier. Failure to stay close to 142 will open up 140.0 as the next level of potential support, while a move back up to 143 will invalidate the H&S pattern.
Stochastic hints of further sell-off, with readings breaking back under 80.0 and still a distance to run before entering the Oversold region. Recent readings peak also coincide with the failure to break above 143.0, increasing the current bearish bias.
Daily Chart
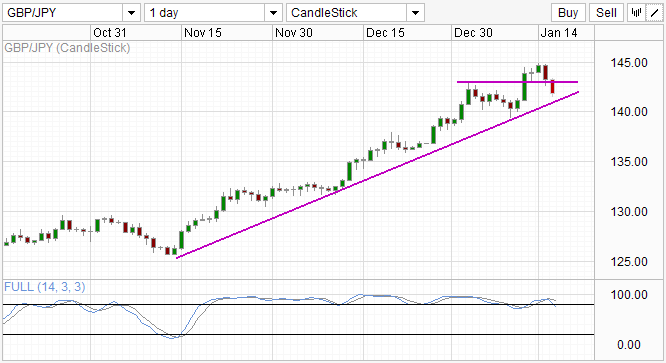
Daily chart suggest the price could still find some support along the mid-term rising trendline. However, a bearish picture is still in the cards as Stochastic readings will most likely breach below 80.0 when price break below the trendline, acting as double jeopardy for the bulls.
This article is for general information purposes only. It is not investment advice or a solution to buy or sell securities. Opinions are the authors; not necessarily that of OANDA Corporation or any of its affiliates, subsidiaries, officers or directors. Leveraged trading is high risk and not suitable for all. You could lose all of your deposited funds.
Latest posts by marketpulsefxstaff (see all)
- Oil Remains Near Multi-Month Lows - 6 August 2015
- U.S. Dollar Higher on Recent Data - 6 August 2015
- Greece’s PM Tsipras: Loan Deal with Lenders Close - 6 August 2015