Hourly Chart
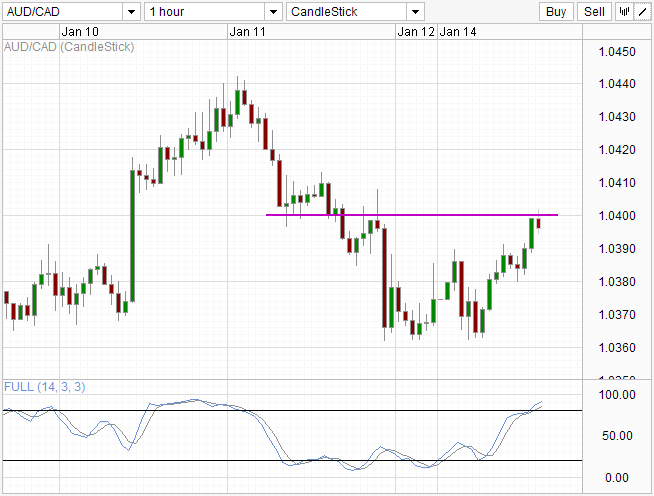
1.04 remain contentious between bulls and bears with bulls attempting to test 1.04 once more after price fell back to 1.036-1.038 trading range on Friday. Stochastic reading has crept back into Overbought territory just before bulls are able to reach a firm foothold above 1.04.
Daily Chart
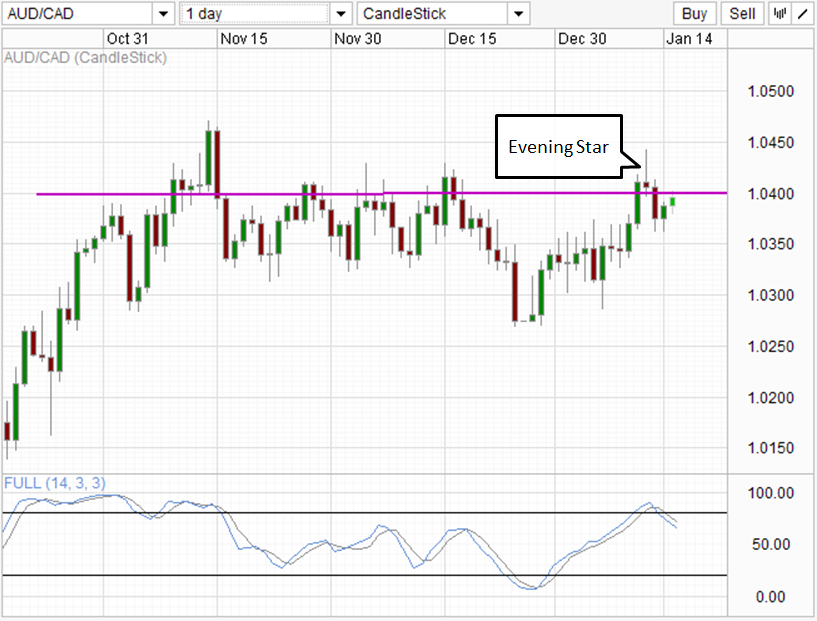
Daily chart highlights 1.04 as a significant resistance with price reversing shortly after pushing above the 1.04 level. Current rally back towards 1.04 does not invalidate the Evening Star setup, which will increase in relevance especially if price retreats before breaching 1.04. Furthermore, Stochastic provides further bearish sentiment with readings back under 80.0 after hitting “Overbought” following the Evening Star candle.
Weekly Chart
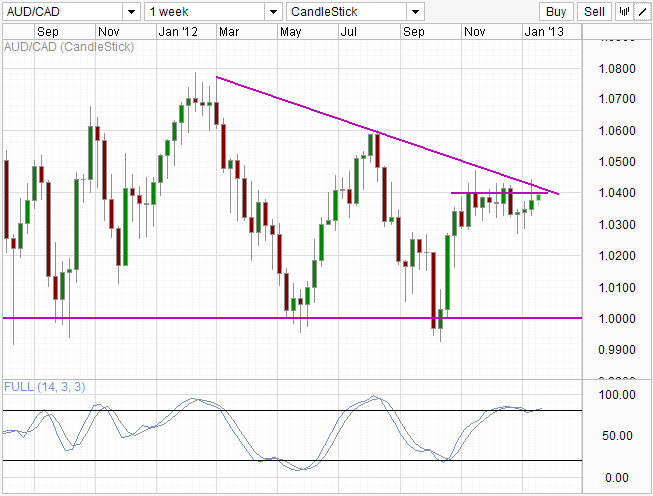
More of the same from Stochastic as reading hovers just above 80.0 right now. Weekly chart provides another downward trendline adding pressure on top of 1.04. It is also interesting to note that price has rarely moved sideways except for current consolidation zone which started since Nov ’12. This implies higher momentum (either bullish or bearish) should price break out from this current zone between 1.03 -1.04. Further support could be found around 1.02 and parity, while 1.06 (previous swing high) provides some resistance should price break upwards from the Triangle apex.
This article is for general information purposes only. It is not investment advice or a solution to buy or sell securities. Opinions are the authors; not necessarily that of OANDA Corporation or any of its affiliates, subsidiaries, officers or directors. Leveraged trading is high risk and not suitable for all. You could lose all of your deposited funds.
Latest posts by marketpulsefxstaff (see all)
- Oil Remains Near Multi-Month Lows - 6 August 2015
- U.S. Dollar Higher on Recent Data - 6 August 2015
- Greece’s PM Tsipras: Loan Deal with Lenders Close - 6 August 2015