Weekly Chart
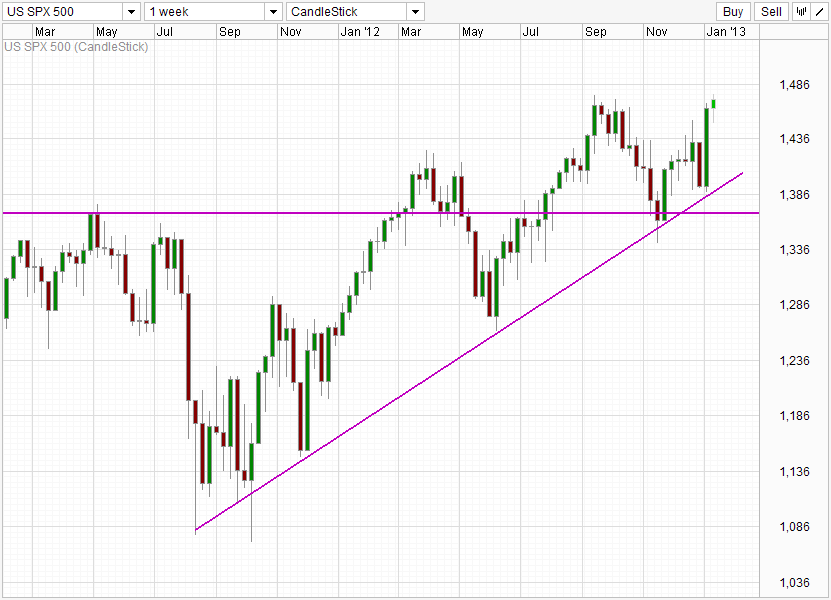
Many journalists and newswires cheered as S&P 500 hit 5 year closing high, giving the impression that we’re on our way to yet another strong bullish breakout. Unfortunately, the truth is more boring than fiction. From the weekly chart, one can barely tell the difference between current levels against Sep ’12 highs, making celebrations a little bit premature. What bulls should really be thankful about is the fact that the upward rising trendline since Sep ’11 remain at play, with the current sequence of Higher Highs, Higher Lows being unbroken. Without a doubt, market is recovering, since 2011 that is, will we continue to push higher? Likely, but lets see what the short-term chart tells us.
Hourly Chart
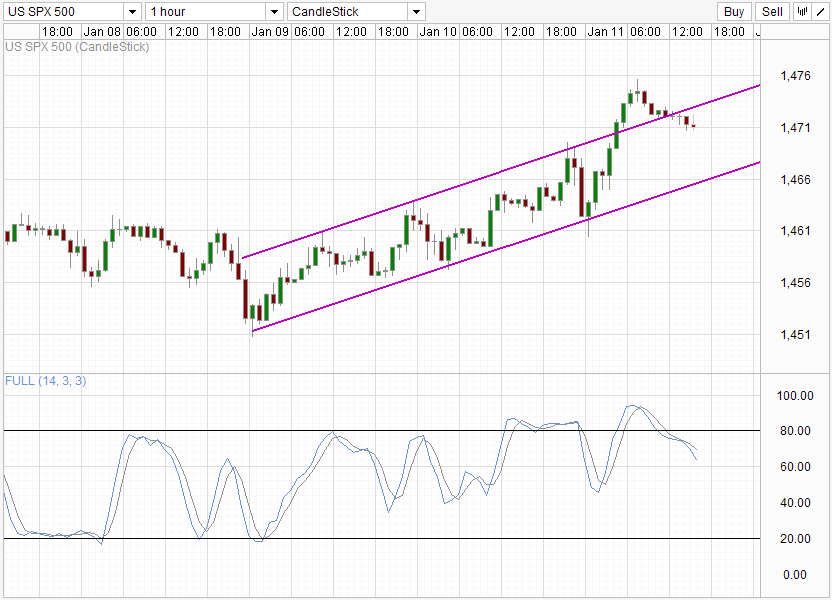
Hourly chart does not appear as rosy, with price moving down quickly after hitting the highs. Price has crept back into the rising channel, with Stochastic indicator hinting more downside to come as readings break below 80.0 after entering “Overbought” territory. Granted, the overall theme is still bullish as the Rising Channel remains in play, however bulls might need to hold out for another wave of pullback before they push on again.
US10Y Daily
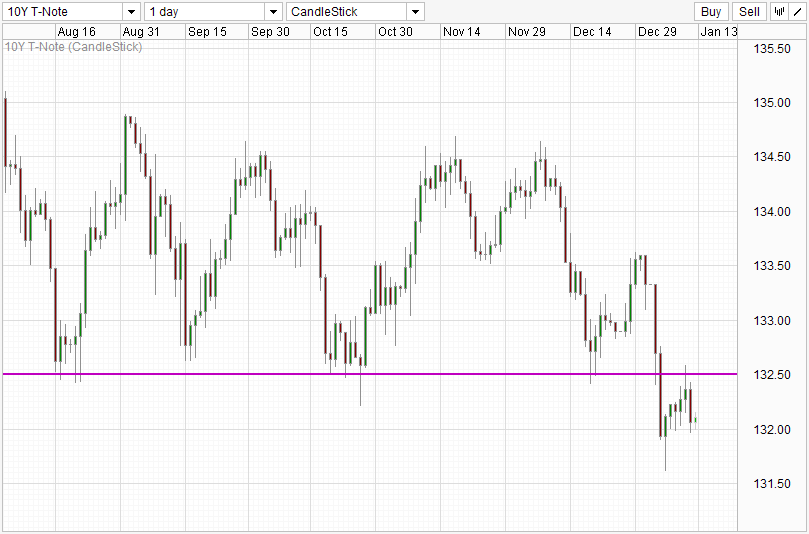
Treasuries Yield agrees with a bullish stock outlook, with US10Y unable to breach 132.50, moving back down to 132.00. A breach below 132.00 can be interpreted as a showing of market confidence as investors ditch safer treasuries to enter into riskier but higher return stocks.
This article is for general information purposes only. It is not investment advice or a solution to buy or sell securities. Opinions are the authors; not necessarily that of OANDA Corporation or any of its affiliates, subsidiaries, officers or directors. Leveraged trading is high risk and not suitable for all. You could lose all of your deposited funds.
Latest posts by marketpulsefxstaff (see all)
- Oil Remains Near Multi-Month Lows - 6 August 2015
- U.S. Dollar Higher on Recent Data - 6 August 2015
- Greece’s PM Tsipras: Loan Deal with Lenders Close - 6 August 2015