Daily Chart
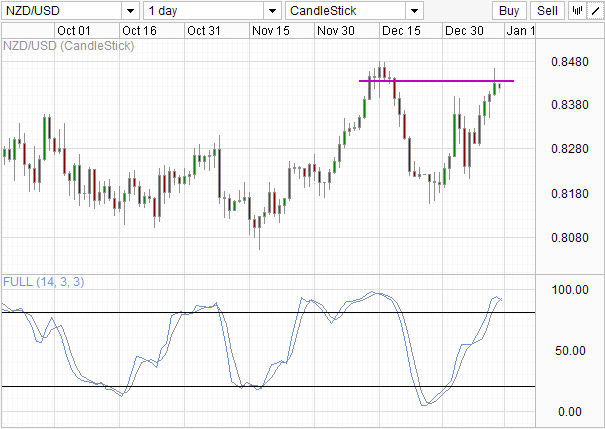
Rally in Kiwi hit a snag as price failed to overcome 0.843, the support for Dec 2012. Stochastic reading shows a potential crossing in the works, but a proper bearish signal can only be confirmed with readings below 80.0 and NZD/USD failing to hold above current levels.
Hourly Chart
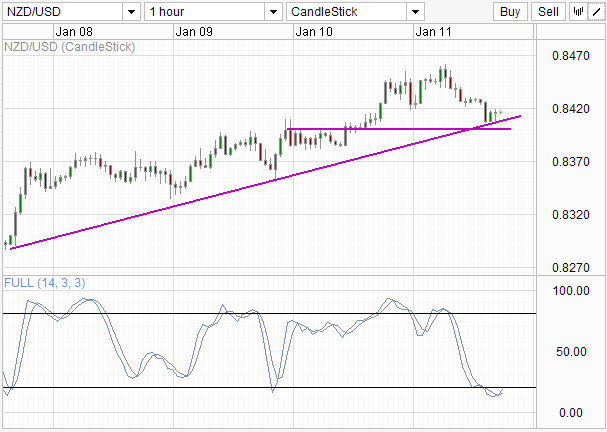
Hourly chart paints an opposite story with Stochastic reading forming a crossover in the Oversold territory. Price is also trading above 84.0 round number (horizontal line) and also the upward trending line formed this week. Keep a lookout on how price move early next Monday for any indication of bearish breakout or continuation of this week’s bull run.
GBP/NZD Hourly
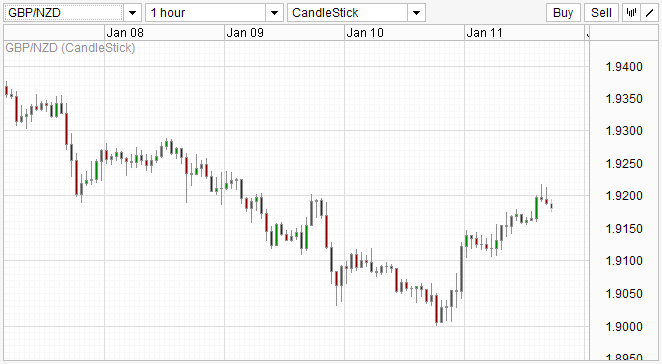
GBP/NZD is also facing strong resistance around 1.92. NZD/USD movement next week will have high influence on this pair’s ability to break above 1.92.
This article is for general information purposes only. It is not investment advice or a solution to buy or sell securities. Opinions are the authors; not necessarily that of OANDA Corporation or any of its affiliates, subsidiaries, officers or directors. Leveraged trading is high risk and not suitable for all. You could lose all of your deposited funds.
Latest posts by marketpulsefxstaff (see all)
- Oil Remains Near Multi-Month Lows - 6 August 2015
- U.S. Dollar Higher on Recent Data - 6 August 2015
- Greece’s PM Tsipras: Loan Deal with Lenders Close - 6 August 2015