8 Hourly Chart
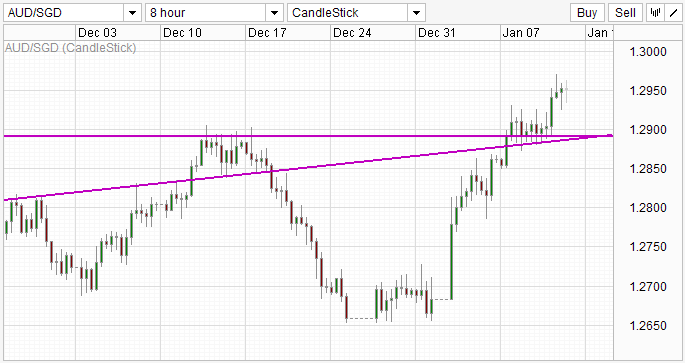
AUD/SGD broke away from 1.29, and trades around 1.295 currently as AUD/USD broke 1.05 this week. Bullish momentum from the low of 1st Jan ’13 does not appear to be losing steam, with price failing to establish any meaningful short-term pullback, with the largest decline within 2013 limited to around 50 pips.
Weekly Chart
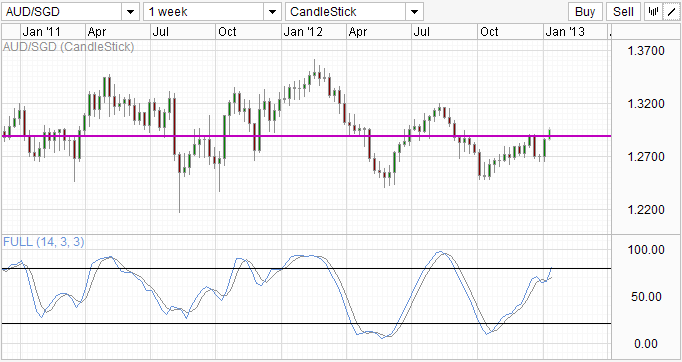
From the weekly chart, Bulls will be glad that price managed to clear the resistance before entering the Overbought region, with historical levels suggesting that Overbought readings could go higher before we see potential pullbacks again. Using previous peak in Aug ’12 as reference, current trend could see Stochastic peaking around when price hits 1.32 as well. As we are using Weekly charts here, when this could occur might be a few months down the road. Along the way, we have RBA rates decisions in Feb, Mar and April, while MAS is scheduled to meet in April. Assuming that both Central Banks keep their reference rates on hold, as widely believed by analysts, this scenario supports a strengthening of AUD which may push AUD/SGD towards 1.32 until April where SGD strength may take over at least for the week of MAS announcement.
More Links:
AUD/USD – Australian Dollar Climbs as Chinese Trade Surplus Jumps
This article is for general information purposes only. It is not investment advice or a solution to buy or sell securities. Opinions are the authors; not necessarily that of OANDA Corporation or any of its affiliates, subsidiaries, officers or directors. Leveraged trading is high risk and not suitable for all. You could lose all of your deposited funds.
Latest posts by marketpulsefxstaff (see all)
- Oil Remains Near Multi-Month Lows - 6 August 2015
- U.S. Dollar Higher on Recent Data - 6 August 2015
- Greece’s PM Tsipras: Loan Deal with Lenders Close - 6 August 2015