Hourly Chart
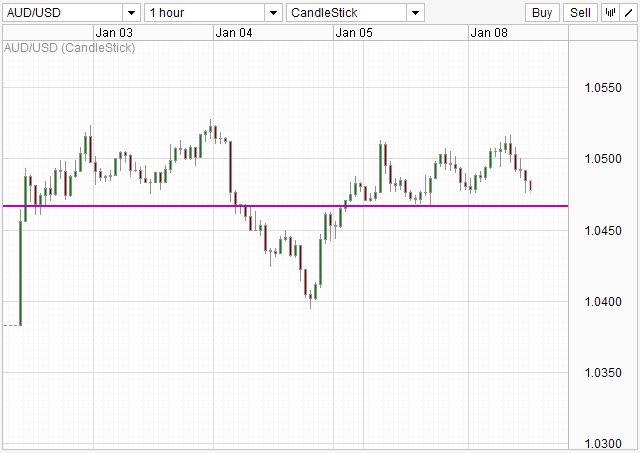
Aussie currently trading in the consolidation range found between 1.047 – 1.052. Break below support opens up 1.04 as further support.
Weekly Chart
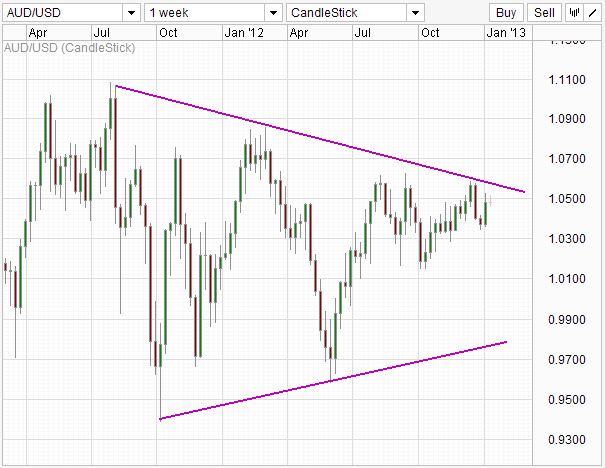
From the weekly chart, a wedge is formed with upper wedge providing resistance together with the 1.05 round number pressing AUD/USD down.
Weekly Chart (Zoomed Out)
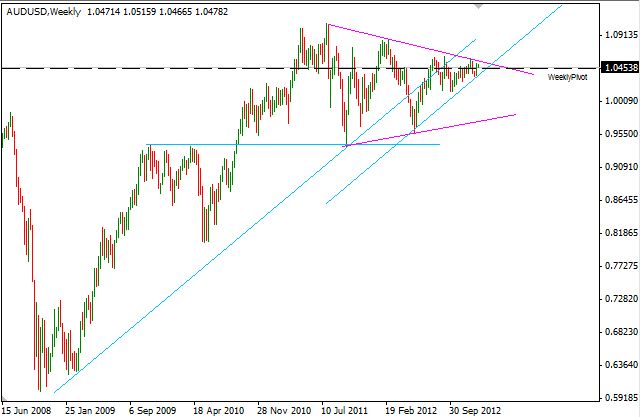
However, when we zoom out, long-term trend remains bullish, with the current wedge interpreted as a short-term (relatively) retracement. Nonetheless, downside pressure cannot be dismissed, and may accelerate if price break below this week’s Weekly Pivot around 1.045. An alternate read would be the Blue Channel, where price may break upwards after a few weeks should price maintain current levels.
This article is for general information purposes only. It is not investment advice or a solution to buy or sell securities. Opinions are the authors; not necessarily that of OANDA Corporation or any of its affiliates, subsidiaries, officers or directors. Leveraged trading is high risk and not suitable for all. You could lose all of your deposited funds.
Latest posts by marketpulsefxstaff (see all)
- Oil Remains Near Multi-Month Lows - 6 August 2015
- U.S. Dollar Higher on Recent Data - 6 August 2015
- Greece’s PM Tsipras: Loan Deal with Lenders Close - 6 August 2015