Weekly Chart
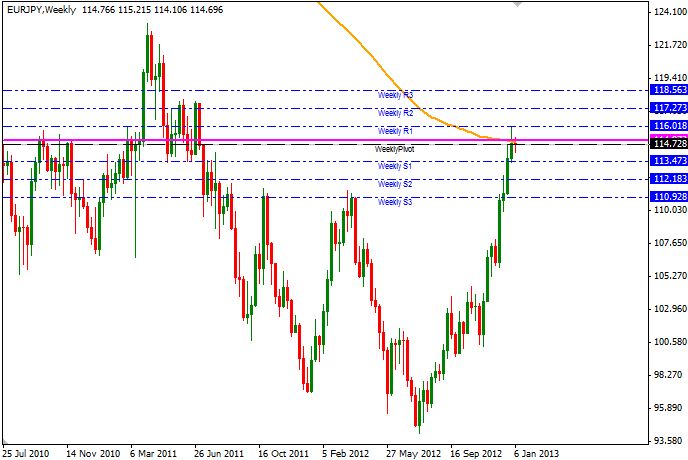
Current price level is sitting on a busy junction of important lines: This week’s Pivot (dash), Resistance line (pink) and SMA 200. Failure to hold onto current levels opens up Weekly S3, which is the confluence of the twin peaks seen in Oct 2011 and Mar 2012.
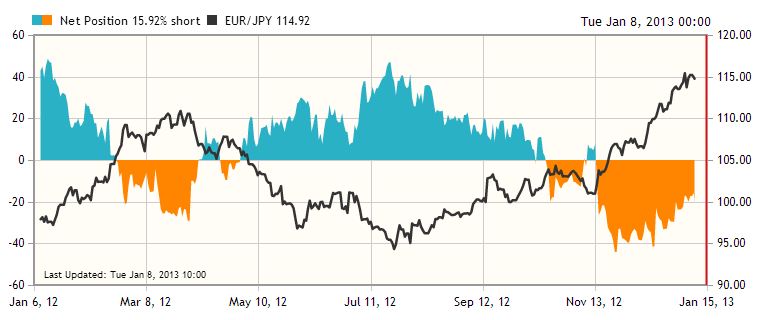
Open position ratio is generally used as a contrarian indicator: Long positions decrease -> price rally and vice versa (see Jul ’12 Long Position peak). As current ratio is still showing Net Short position, current bullish bias/momentum should theoretically remain. However, the Short positions have also lost significant ground since the trough formed in Nov ’12, suggesting that we could see a slow down in bullishness soon, or at least a meaningful pullback before JPY seasonality takes over leading into end of Q1 ’13.
This article is for general information purposes only. It is not investment advice or a solution to buy or sell securities. Opinions are the authors; not necessarily that of OANDA Corporation or any of its affiliates, subsidiaries, officers or directors. Leveraged trading is high risk and not suitable for all. You could lose all of your deposited funds.
Latest posts by marketpulsefxstaff (see all)
- Oil Remains Near Multi-Month Lows - 6 August 2015
- U.S. Dollar Higher on Recent Data - 6 August 2015
- Greece’s PM Tsipras: Loan Deal with Lenders Close - 6 August 2015