Daily Chart
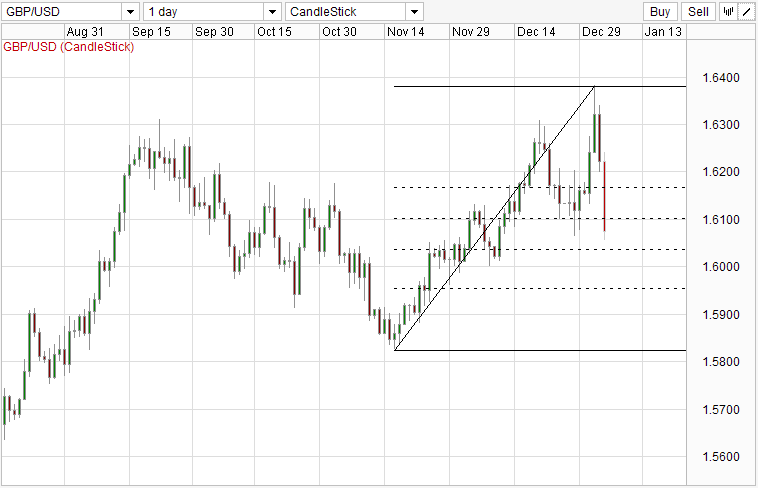
Another Top confirmed in GBP/USD? Some may consider the recent break of 1.61 – round number and 50% Fib – as confirmation for the Tweezer Top/Dark Cloud Cover bearish reversal pattern formed.
If that interpretation holds, 1.58-1.59 becomes viable downside targets. However, huge uncertainty lies ahead around 1.60 that saw price fluctuate between 1.595 – 1.61 for an extended period of time back in Q4 2012. Furthermore, a short term retracement could potentially occur following such an intense move downward in such a short time.
Should there be any retracement back up to the 38.2% (confluence with peaks found in Oct ’12), price action around the level could provide further confirmation from there.
This article is for general information purposes only. It is not investment advice or a solution to buy or sell securities. Opinions are the authors; not necessarily that of OANDA Corporation or any of its affiliates, subsidiaries, officers or directors. Leveraged trading is high risk and not suitable for all. You could lose all of your deposited funds.
Latest posts by marketpulsefxstaff (see all)
- Oil Remains Near Multi-Month Lows - 6 August 2015
- U.S. Dollar Higher on Recent Data - 6 August 2015
- Greece’s PM Tsipras: Loan Deal with Lenders Close - 6 August 2015