Hourly Chart
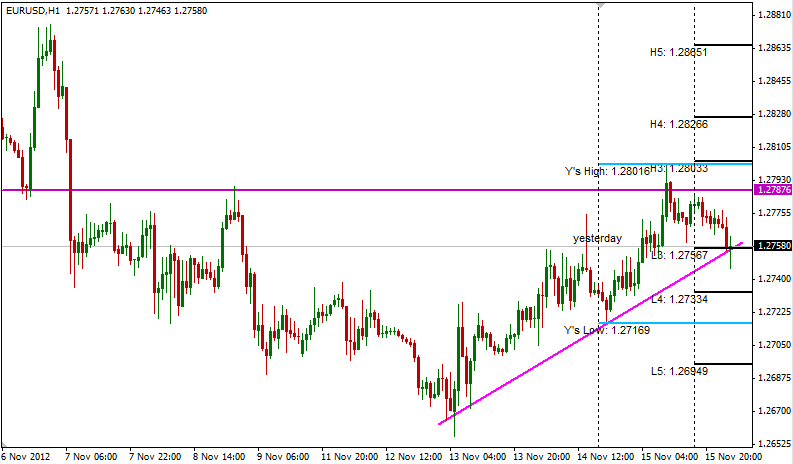
EUR/USD traded lower after price failed to break 1.278 – 1.28 resistance zone. Currently price trading above L3, supporting price afloat together with the upward trendline that defines current rally/bullish retracement.
Break of L3 opens up L4 and L5 as potential downside targets.
Daily Chart
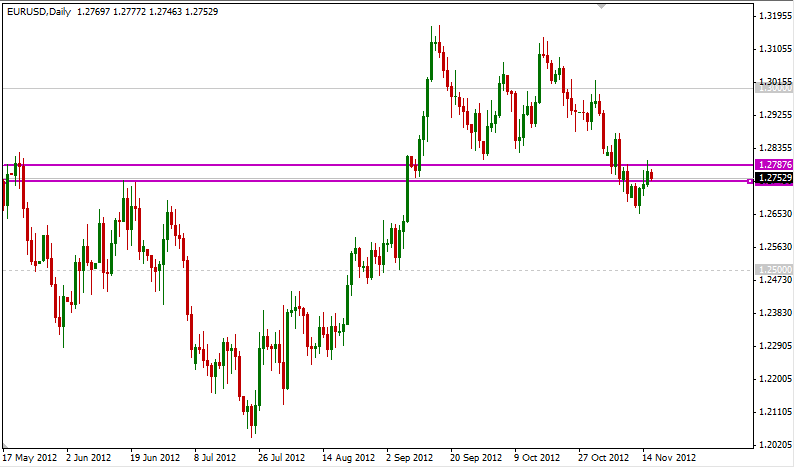
Price pulled back into the previous support zone after the false breakout a few days ago. Currently we are still trading within the support/resistance range and could see strong momentum either way if breakout on either side occurs.
This article is for general information purposes only. It is not investment advice or a solution to buy or sell securities. Opinions are the authors; not necessarily that of OANDA Corporation or any of its affiliates, subsidiaries, officers or directors. Leveraged trading is high risk and not suitable for all. You could lose all of your deposited funds.
Latest posts by marketpulsefxstaff (see all)
- Oil Remains Near Multi-Month Lows - 6 August 2015
- U.S. Dollar Higher on Recent Data - 6 August 2015
- Greece’s PM Tsipras: Loan Deal with Lenders Close - 6 August 2015